

AWS forecast service modelling Electricity consumption
Timeseries forecasting is the process of looking at historical data to make predictions about the future. Companies can use these predictions to extract actionable insights that drive innovation. Often, the mechanisms behind the transformation of raw data into business value is a mystery to non-specialists. This is because timeseries forecasting requires expert knowledge of algorithms and mathematical concepts such as calculus. This is a domain reserved for the highly trained specialists, often not accessible to the average user. However, with the development of Amazon Forecast this could be changing.
Amazon Forecast is a fully managed service that simplifies the process of timeseries forecasting by hiding the inner complexity from the users. The user simply has to provide an input data, Forecast then automatically applies and selects the most optimal machine learning algorithm for the data to generate accurate predictions with little to no user intervention. This system is known as a ‘Black Box Method’, where a user can conduct complex modelling tasks without worrying about the low-level calculus and algorithms.
This movement of machine learning from experts to general users marks a significant paradigm shift known as AutoML (Automatic Machine Learning).
Within this blog Amazon Forecast will be explored from the perspective of a non-expert general user to assess how easy it is to get started producing accurate future predictions. In other words, can someone who is not a professional machine learning specialist produce professional models?
What we will predict
In this hypothetical scenario we work for an electricity provider and have been tasked with building a model to predict future electricity consumption for our customers. The input data we have been provided contains measurements for electricity consumption (Kw) every hour for 370 different clients from January 2014 – November 2014. This dataset contains 2,707,661 observations. We will build a model to predict the electricity consumption for the 1st of October 2014, so 24 hours into the future for every customer.
Creating the electricity forecast
Unfortunately, Forecast is not able to clean and prepare your input data, you must ensure the data is prepared beforehand. This is the only technical step that is required in the forecasting process. In this instance, we prepare the dataset to match the schema requirements of Forecast as shown in the table below. Once prepared the data must be stored in an S3 as a CSV.
| Client | Timestamp | Consumption |
| Client_1 | 2014-01-01 01:00:00 | 23.64 |
| Client_0 | 2014-0101 02:00:00 | 9.64 |
As a general user we can achieve everything we need to generate a forecast within the Forecast Console. This is a no-code user interface in the form of a Dashboard. Within this dashboard we can manage all aspects of the forecasting process, this process is implemented in 3 easy steps:
- First, you import your Target time series data. This is simply the process of telling Forecast where to find your prepared data in S3 and how to read the contents (schema).
- Next, you use this Target time series to create a predictor. A predictor is a Forecast model trained on your timeseries. This is where the AutoML aspects of Forecast are truly utilised. When training a predictor in a typical timeseries forecast, the user would need to identify the optimal algorithm to train the model and then optimise this model. Within Forecast, all of these steps are done automatically using back testing. Back testing is the process of retaining a portion of the training data to train on all the algorithms to find the best fit.
- Finally, with the model trained, we can generate a forecast. This is as simple as a few clicks on the dashboard. This will generate future predictions of energy consumption for every hour for every customer.
Now, with zero coding or expert input we have generated an advanced forecast utilising cutting-edge deep learning machine learning algorithm. If it appears very simple, that’s because it is. The dashboard was designed to be simple and easy to use. For more advanced users Python can be used to connect to Forecast where you gain significantly more control over the process. But as a general user such control is not necessary.
Visualise and export the electricity consumption predictions
For this section we will visualise the forecasted predictions for customer 339, found in the graph below. As we actually have the real observed values for the 1st of October 2014, we can compare our predictions with the actual observed electricity consumption.
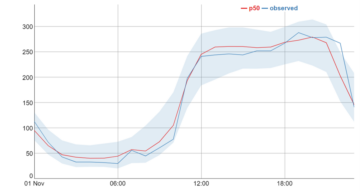
In the graph the darker blue line represents the real values. We can also see a red line and a light blue area. This blue area is known as the 80% confidence interval, indicating that we are 80% confident that the real value will lie somewhere within this area. The red line, p50 value (median forecast) can be considered as an indication of the ‘most likely outcome’.
As we can see, our forecast appears to be very accurate in predicting the electricity consumption for this customer, with the predicted values closely following the observed values. In practice, these forecasts could be used in a variety of ways. For example, we could share this forecast with the customer, who can then adjust their consumption patterns to reduce energy usage during peak hours and thus lower energy bills. For the energy provider, these forecasts could be used in load management and capacity planning.
Conclusion
The main purpose of Forecast and AutoML is to allow non-experts to develop machine learning models without the required expertise. AutoML also enables experienced data scientists by reducing time spent optimising models. Forecast achieves both, as I, a non-expert, was able to develop an advanced forecasting model without any interaction with the complex underlying mechanisms. It is clear Forecast extends the power of time series forecasting to non-technical experts, empowering them to make informed decisions from machine learning insights.