Solita has received the Microsoft Azure Data, Analytics and AI Partner of Year award two times in a row, holds several Microsoft competencies, is Azure Expert MSP and has advanced specialization in Analytics on Microsoft Azure. These recognitions are granted by Microsoft and are based on the hard work Solitans have done in our projects. Let's find out what kind of services our Microsoft Azure practice offers and what it means in our daily work.
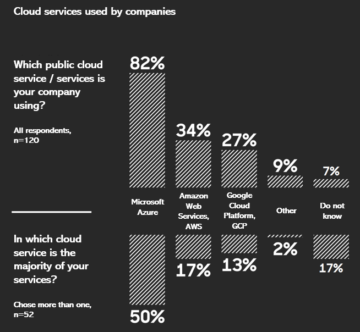
According to this study made by Solita’s Cloud unit, the most popular cloud services used by large Finnish companies are Microsoft Azure (82 %), Amazon Web Services (34 %) and Google Cloud Platform (27 %). Significant part of the respondents (43 %) are operating in multi-cloud environments, meaning they are using services from more than one provider.
Why is Azure so popular? From data services point of view, Azure offers mature services to create complex data platforms that can meet any requirement. Many organizations already utilize the Microsoft 365 and Dynamics 365 ecosystems and for them Azure is a justified technology choice for the cloud journey. In addition to these services, the Microsoft ecosystem includes Power Platform making it a comprehensive and mature platform for any kind of needs. It’s not surprising that during the last few years, we have seen a significant increase in the popularity of Azure services in the Nordics and in demand for Azure experts.
What kind of Azure-based deliveries has Solita done?
Combining data, tech and human insights is the bread and butter of our offering. When it comes to Azure-based data analytics solutions, we are proud of our works like this data platform that combines modern cloud technology and the on-premises world in a unique way, the IoT edge computing solution (video!) for forest harvesting, the streaming data solution to support operational decision-making in metro traffic, and this machine learning based real-time dashboard running on the Azure platform. Technologies cover Azure capabilities widely including e.g. Synapse Analytics, Azure Stream Analytics, Azure Databricks, Azure ML and Power BI.
In addition to the strong offering with Azure data services, our Cloud unit helps companies with the implementation of Azure cloud platforms. We have received the rare Microsoft Azure Expert Managed Services Provider certification. Check out also Solita CloudBlox, our modern managed cloud service.
What makes Solita the best Azure consultancy in northern Europe?
We put focus on finding the best solutions for our customers. Our approach is to look at the overall architecture, find suitable tools for different business use cases and build well-integrated solutions. We focus on the business objectives. We are not afraid of talking business and participating in refining the requirements with the customer. We have a strong emphasis on developing the skills of our people so that we have extensive knowledge of the solutions offered in the market and what works in different situations.
From an employee point of view we make a promise that at Solita you get to work with state of the art technology and delivery methods. In our projects we use agile practices and apply DataOps principles. What this means in practice is that we support project teams with standardized ways of working, utilize automation always when applicable, build solutions for continuous delivery and are adaptive to change when needed.
Solita has a strong culture of competence development
Solitans hold hundreds of Microsoft recognitions for passed certifications. Through our partnership with Microsoft we have access to Microsoft’s Enterprise Skills Initiative that offers interactive courses, certification preparation sessions and practice exams so we can improve our Azure skills and earn certifications. We encourage everyone to spend time on competence development to keep our skills up-to-date. In leading-edge technology projects we also have the possibility to collaborate and investigate solutions with Microsoft’s Black Belt professionals who have the deepest technology knowledge in these specific areas.
In addition, Solita has an internal program called Growth Academy that offers learning opportunities and competence development for all Solitans. Growth Academy makes learning more visible and we encourage everyone to develop their skills, learn and grow. Through Growth Academy we offer learning content for Azure for different certifications and learning paths for different roles. We also have active Slack communities where people share knowledge and ask questions.
Meet Johanna, Tuomas and Tero! Our Consultants, who all work with data analysis and visualizations. Let’s map out their journey at Solita and demystify the work of Analytics Consultants!
All three have had different journeys to become an Analytics Consultant. Tuomas has a business degree and Tero started his career working with telecommunications technology. Johanna however found her way to visualizations quite young: “I created my first IBM Cognos reports as a summer trainee when I was 18 and somehow, I ended up studying Information Systems Science.” It has been, however, love at first sight for all of them. Now they work at Solita’s Data Science and Analytics Cell.
What is a typical Analytics Consultant’s workday like?
The interest in versatile work tasks combines our Analytics Consultants. Tuomas describes himself as “a Power BI Expert”. His days go fast by designing Power BI phases, modelling data, and doing classical pipeline work. “Sometimes I’d say my role has been something between project or service manager.”
Tero in the other hand is focusing on report developing and visualizations. He defines backlogs, develops metadata models, and holds client workshops.
Johanna sees herself as a Data Visualization Specialist, who develops reports for her customers. She creates datasets, and defines report designs and themes. “My work also includes data governance and the occasional maintenance work,” Johanna adds.
All three agree that development work is one of their main tasks. “I could say that a third of my time goes to development,” Tuomas estimates. “In my case I would say even half of my time goes to development,” Tero states.
Power BI is the main tool that they are using. Microsoft Azure and Snowflake are also in daily use. Tools vary in projects, so Tuomas highlights that “it is important to understand the nature of different tools even though one would not work straight with them”.
What is the best part of an Analytics Consultant’s work?
The possibility to work with real-life problems and creating concrete solutions brings the most joy to our consultants. “It is really satisfying to provide user experiences, which deliver the necessary information and functionality, which the end users need to solve their business-related questions,” Johanna clarifies her thoughts.
And of course, collaborating with people keeps our consultants going! Tuomas estimates that 35% of his time is dedicated to stakeholder communications: he mentions customer meetings, but also writing documentations, and creating project defining, “specs”, with his customers.
Our consultants agree that communication skills are one of the key soft skills to master when desiring to become an Analytics Consultant! Tuomas tells, that working and communicating with end-users has always felt natural to him.
Tero is intrigued by the possibility of working with different industries: “I will learn how different industries and companies work, what kind of processes they have and how legislation affects them. This work is all about understanding the industry and being customer-oriented.”
“Each workday is different and interesting! I am dealing with many different kinds of customers and business domains every day.”
When asked, what keeps the consultants working with visualizations, they all ponder for a few seconds. “A report, which I create, will provide straight benefit for the users. That is important to me,” Tuomas sums up his thoughts. “Each workday is unique and interesting! I am dealing with many different customers and business domains every day,” Johanna answers. Tero smiles and concludes: “When my customers get excited about my visualization, that is the best feeling!”
How are our Analytics Consultants developing their careers?
After working over 10 years with reporting and visualizations, Tero feels that he has found his home: “This role feels good to me, and it suits my personality well. Of course, I am interested in getting involved with new industries and learning new tools, but now I am really contented!”
Tuomas, who is a newcomer compared to Tero, has a strong urge to learn more: “Next target is to get a deeper and more technical understanding of data engineering tools. I would say there are good opportunities at Solita to find the most suitable path for you.”
Johanna has had different roles in her Solita journey, but she keeps returning to work with visualizations: “I will develop my skills in design, and I would love to learn a new tool too! This role is all about continuous learning and that is an important capability of an Analytics Consultant!”
“I would say there are good opportunities at Solita to find the most suitable path for you.”
How to become an excellent Analytics Consultant? Here are our experts’ tips:
Johanna: “Work together with different stakeholders to produce the best solutions. Do not be afraid to challenge the customer, ask questions or make mistakes.”
Tuomas: “Be curious to try and learn new things. Don’t be afraid to fail. Ask colleagues and remember to challenge customer’s point of view when needed.”
Tero: “Be proactive! From the point of view of technical solutions and data. Customers expect us to bring them innovative ideas!”
Understanding your data is driving innovation and markets around the world. Leading companies leverage their data already so well that new products and services are fully built on data. Let's take a look at the hottest Azure service on the market Azure Purview. First let's see what the promise of the service is and then let's dive into the product itself.
Over the last few years, Microsoft has brought several different data solutions to the Azure platform, like Data Factory, Machine learning studio, Synapse, and now Azure Purview.
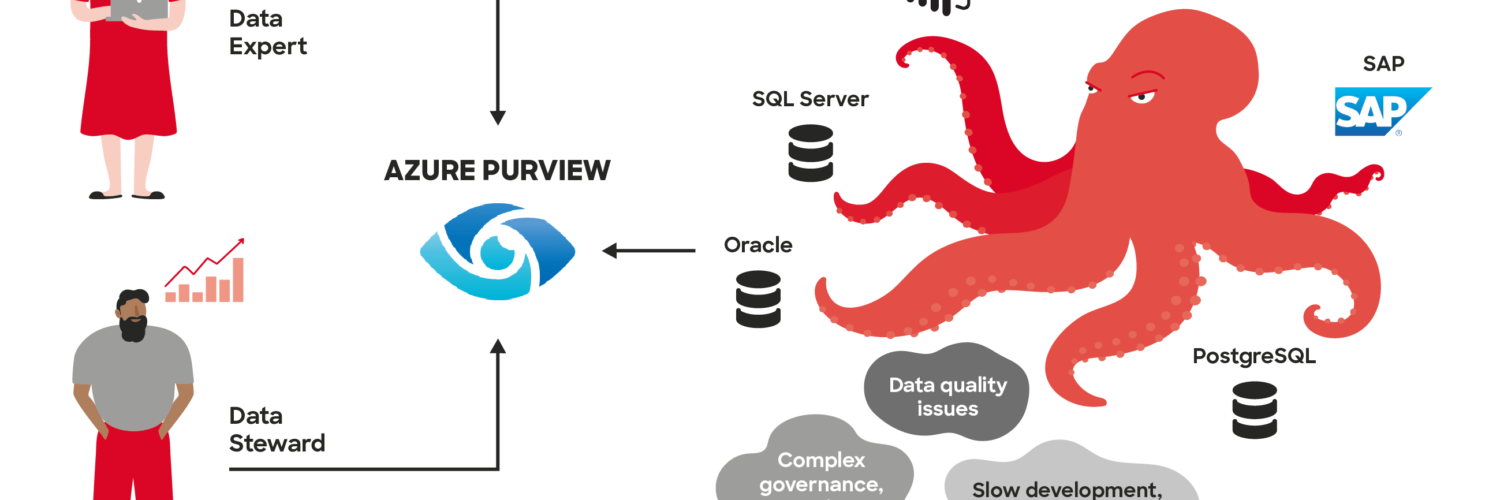
Azure Purview is a unified data governance service that helps you manage and govern your on-premises, multi-cloud, and software-as-a-service (SaaS) data. Easily create a holistic, up-to-date map of your data landscape with automated data discovery, sensitive data classification, and end-to-end data lineage. Empower data consumers to find valuable, trustworthy data. – Microsoft
Why Azure Purview?
What Azure Purview tries to solve is the data discovery and lay down the foundation for data governance. The business point is that everyone wants to know how data is connected between systems and where does the data come from. A very common issue in any organization.
Centralized place for all the metadata
Track and visualize data lineages
Search and find answers about your data
The core problem organizations have is a lack of data ownership. Cataloging data and having a full picture of how different sources are connected, will definitely provide better ownership and transparency. The solution works across on-premises, multi-cloud, and SaaS sources.
Currently, Purview can do three things:
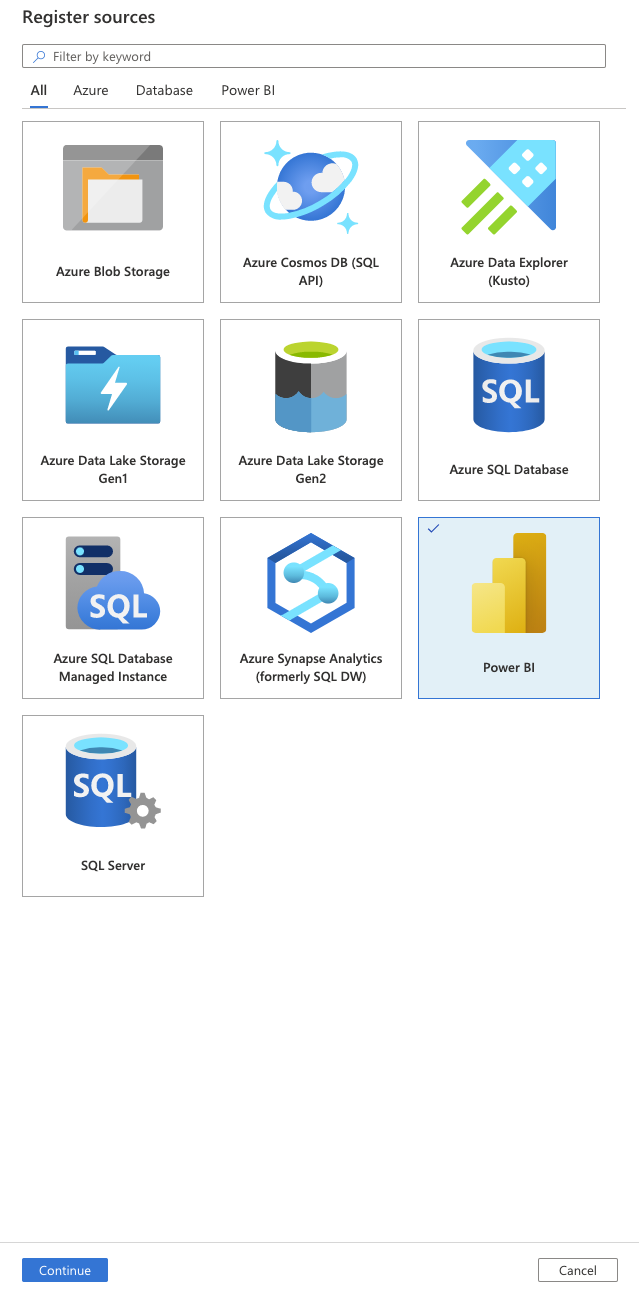
Catalog:
Source registration, automated scanning, and classification and data discovery.
At the moment there is some limitation on what type of source you can register. The majority of Microsoft products are offered in the selection. There will be custom sources available later, this will grow very fast. (Snowflake, Oracle, Salesforce, etc.)
Business glossary and lineage and lineage visualization
This area lets you see where the data is coming from and how it is connected with different systems. For example, it is possible to connect Purview with Data Factory and Power BI, so you can see the whole lineage of how data is joined, transformed, and stored in different parts of the pipeline.
Data insights:
Catalog insights and sensitivity insights
Combining all the metadata that you have and providing analytics and classification. This is defiantly the most interesting part, where you can also label and group different parts of your data into a collection.
Getting started
The service is in preview, so don’t expect much. The ARM template can be found from here, There are not many things you can configure or change. If you want you can use the default parameters and deploy it to Europe west. Hopefully, there will be a similar Git integration like Data Factory has, till then source integrations will be done from the Azure portal.
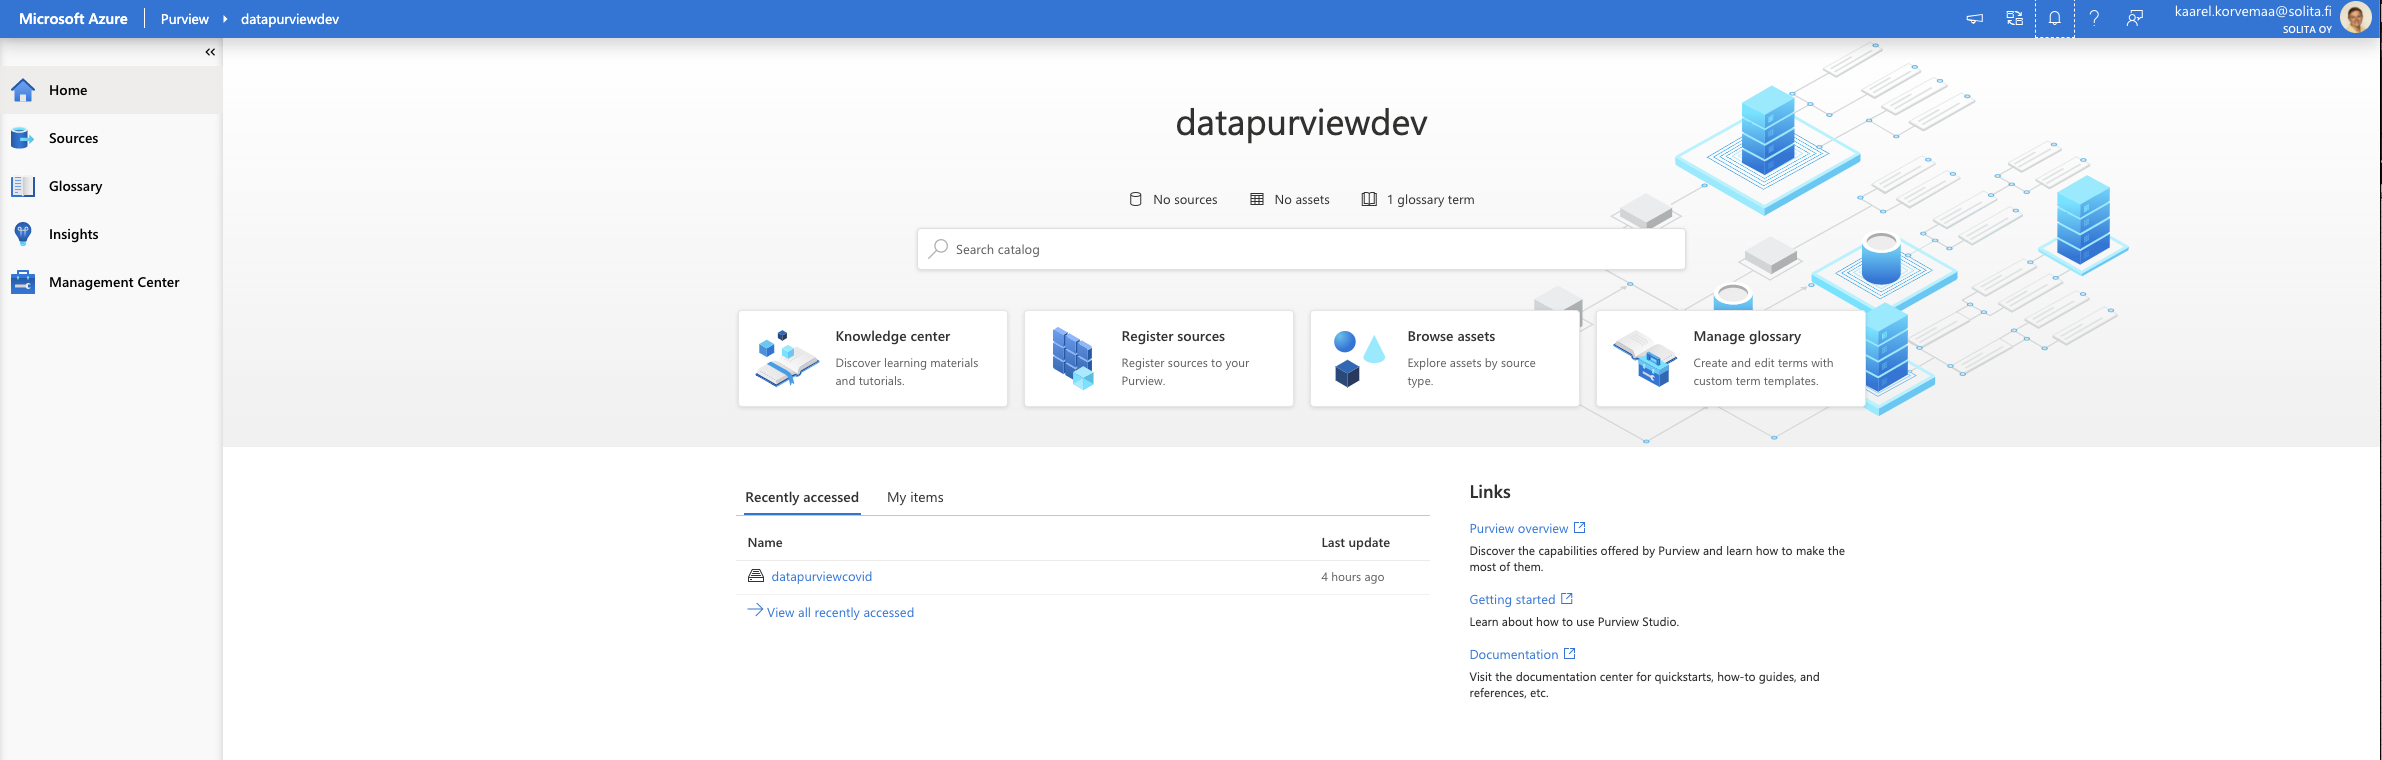
Now that we have deployed, let’s open up Azure Purview studio from Azure Portal.
Azure Purview landing page
Purview
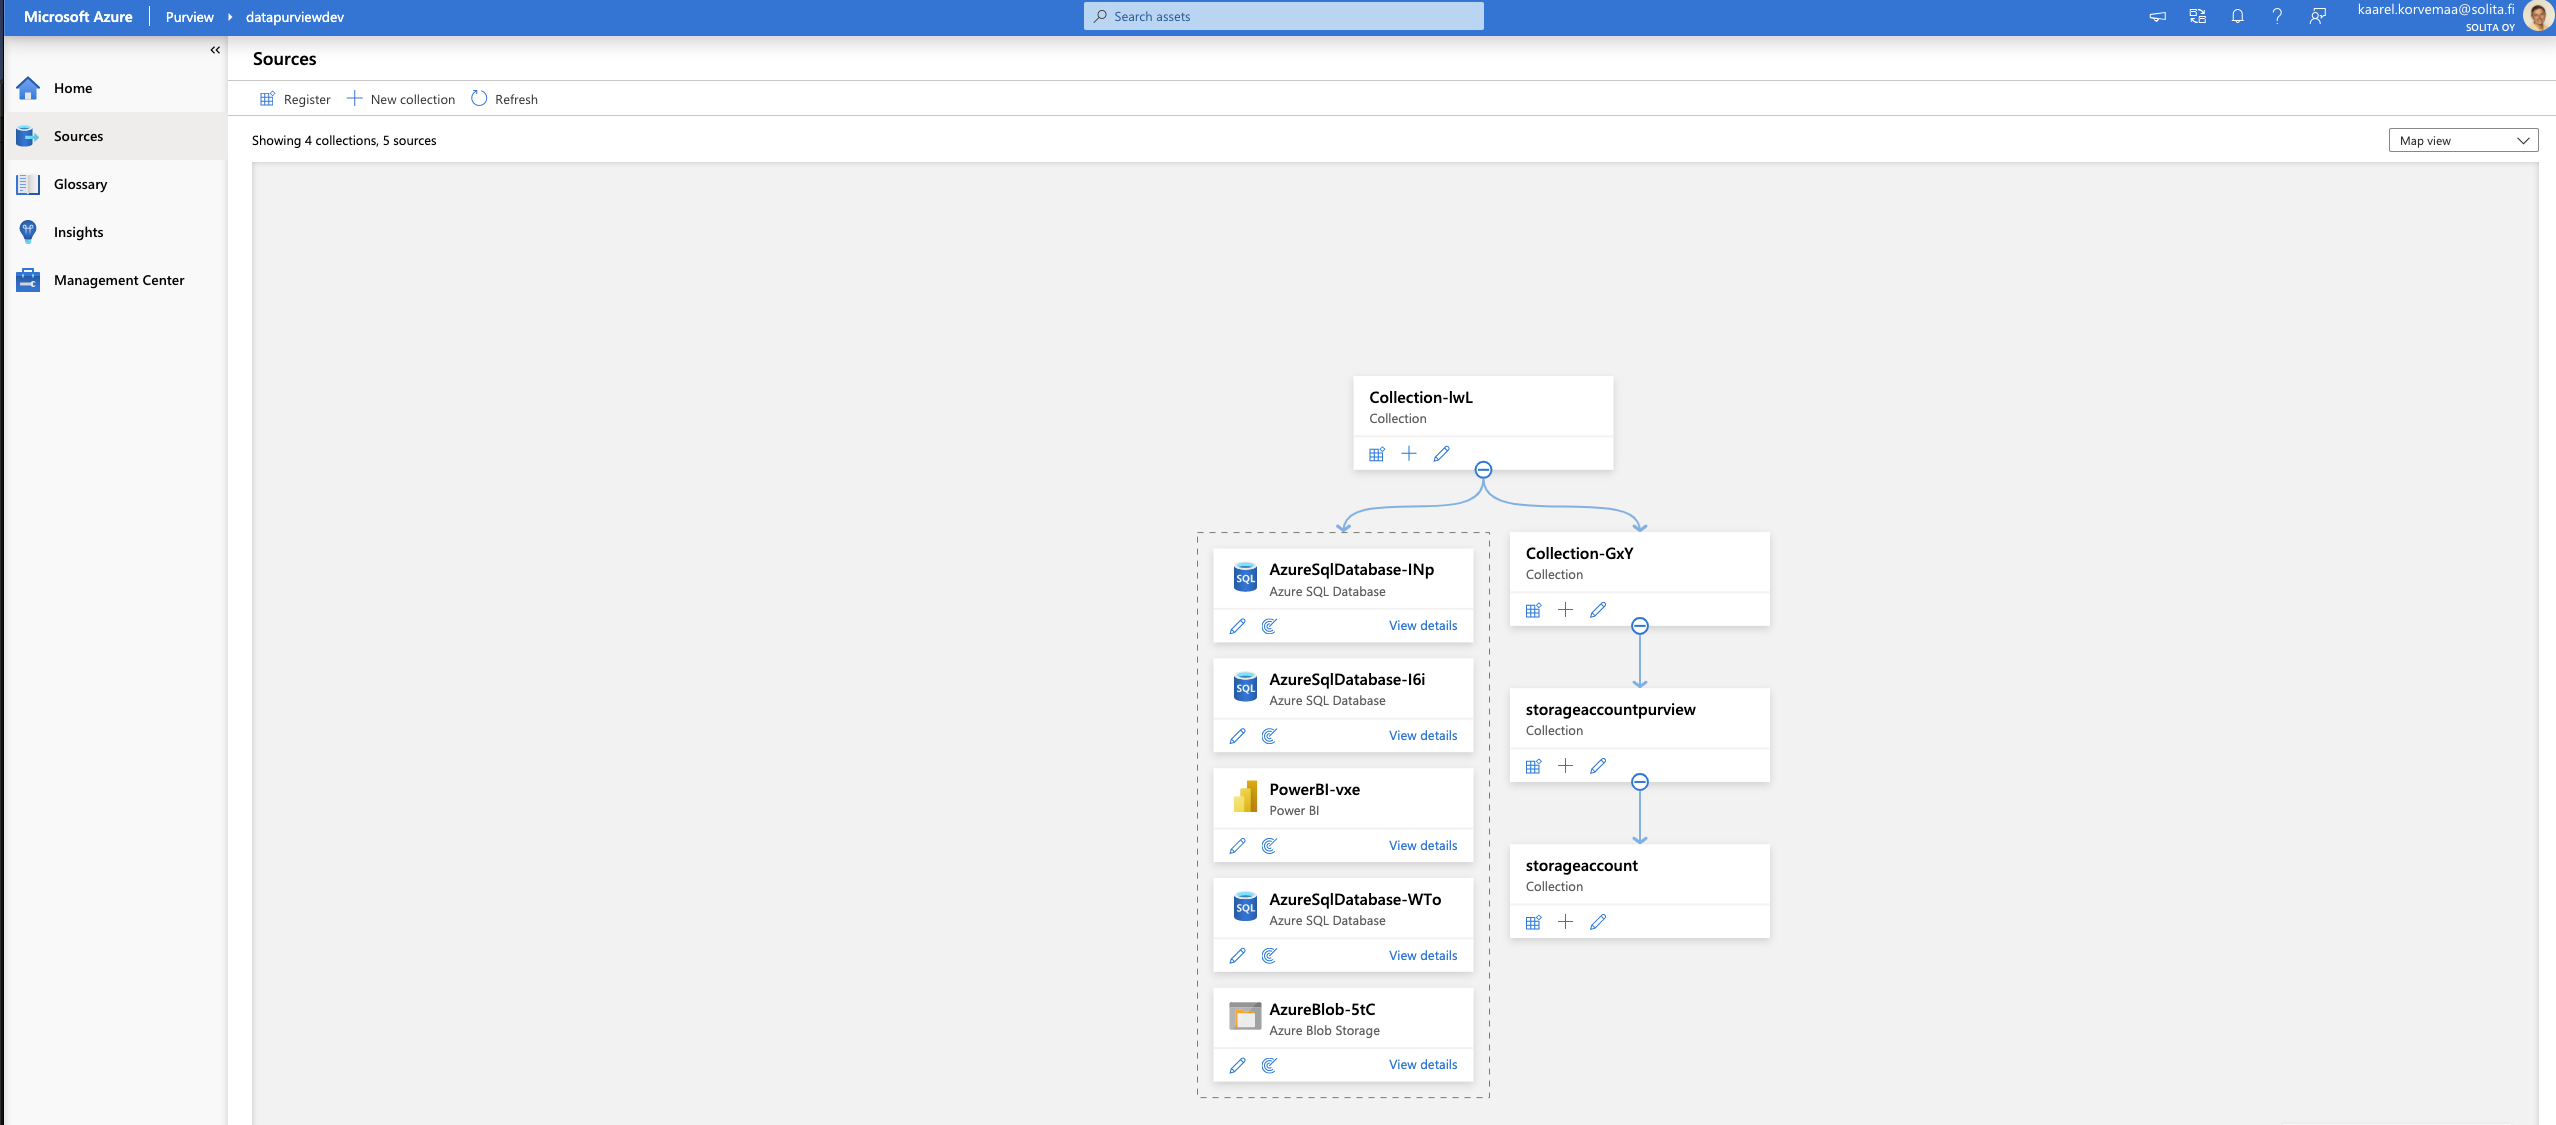
Dive into the data and let’s see how things work. From the left side choose source, from their registry, from credentials, you can either choose to select a key vault and search for the secrets there, but as we previously did the managed identity we already have rights to access the storage account. The best thing is that you can’t type your passwords or other credentials into the portal, like in Data factory. It forces you to use a key vault. This is the beginning of an end to hardcoded credentials? Maybe, let’s hope so!
Source collection that can be created
Remember that whatever you choose as a source system, Purview requires a lot of rights. I like to call owner rights as God rights because it can select * from all tables, which is superuser rights.
Scanning
Now it gets interesting, some rules are applied by default. The list is long, so the more boxes you check the longer it will take to run your scan. This will help if you are working with sensitive data and want to make sure that you comply with the regulations. Creating a new rule, allows you to specify what you want to scan and what not.
Available sources
Remember, this isn’t a live connection. You either do a one time only scan or set a schedule. When running a scan you can do the full scan or incremental, which will search for the changes,
The assumption is that there will be some sort of an event-grid option in the future, where you can trigger scans based on data modifications.
Glossary
This is the place where you create owners for the data. You can add people who have the domain understanding and who are working with the data and how it is connected to different resources. This is the thing you connect with the scanned data. What field relates to what data and what is the definition.
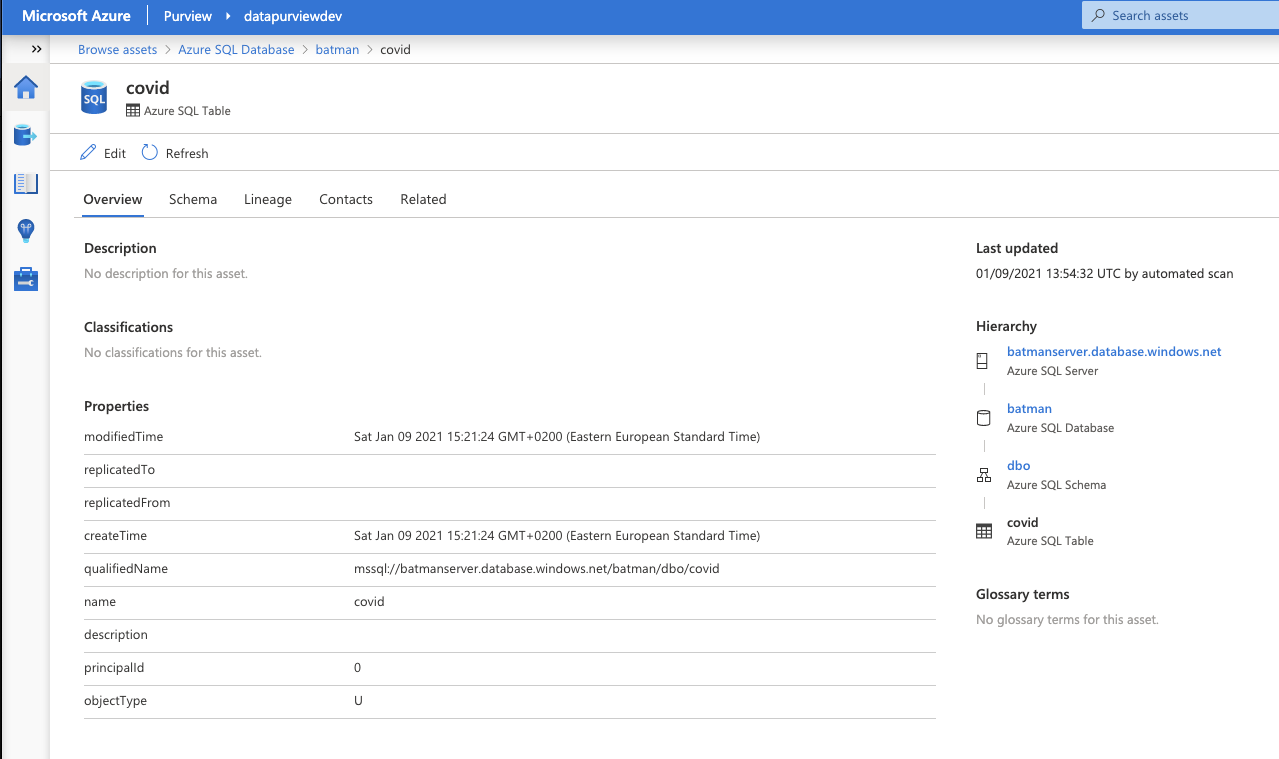
Browsing assets, example from Azure Sql server
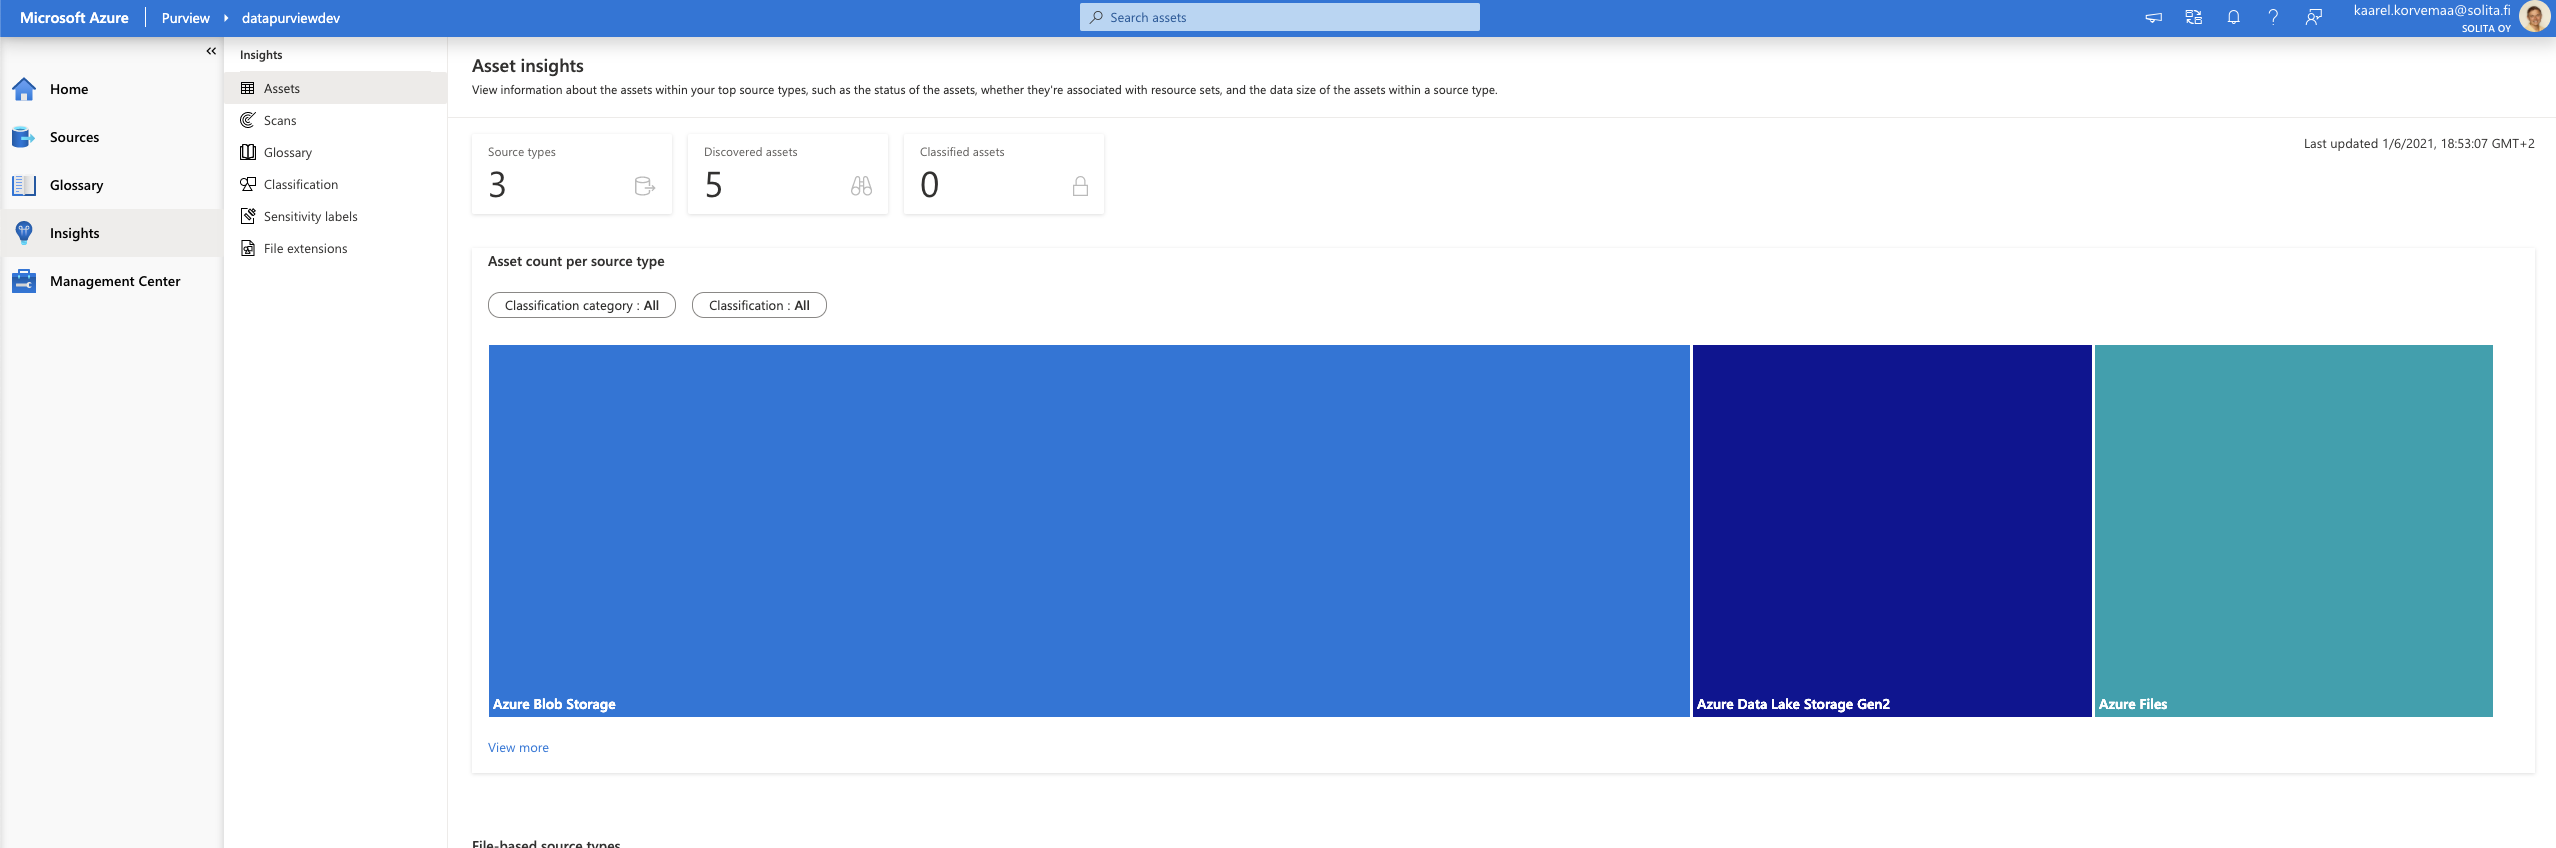
Insights
I used two datasets, one is covid data and another one is credit data. The covid data didn’t automatically give any classifications, but credit data gave. Of course, you can do the classification yourself.
Asset insight
Summary
Considering the amount of data circling in different silos, this will improve data ownership and transparency. At the moment it’s not a production-ready solution but very promising.
Administration level rights that are needed will become a bottleneck for individuals who would like to connect to different sources. Even getting a connection to Power Bi requires Admin level rights.
This needs to be implemented into your data strategy and data governance model. Services like this will need planning, we at Solita have delivered more than +400 different data projects over +20 years. Ping me on Linkedin, more than happy to help your organization out!
This blog post will serve as an overview of the capabilities to give you insight on how to position Synapse Analytics to your overall data platform architecture. We won’t do a deep dive to technical implementation in this post.
Kirjoittaja:Mikko Sulonen Data Engineer
Kirjoittaja:Joni LuomalaData Architect, Azure Data Platform Tech Lead
Azure SQL capabilities have evolved a lot over the years. Azure offers everything from VMs for running your own SQL Server setup, to SQL DB Hyperscale where you are getting your extremely scalable, but still traditional, DB as a service. But what about massively parallel processing data warehousing? Data integrations? Data science? What about limitless analytics? For that, there’s Azure Synapse Analytics.
In November 2019 Microsoft announced Azure Synapse as limitless analytics service and the next evolution of SQL Data Warehouse. Only thing released in GA was re-naming of SQL DW. Other synapse features were only available in limited private preview and for most setting up Synapse Analytics meant setting up former SQL DW. Nowadays Azure Synapse Analytics is a name for the whole analytics service with former SQL DW being part of it. While writing this blog the former SQL DW (also known as Synapse SQL provisioned) is still the only thing in GA, rest of the features are in public preview and anyone can set up Synapse Analytics workspace. Yes, the naming is confusing but hang on, we will try to clear that for you.
This blog post will serve as an overview of the capabilities to give you insight on how to position Synapse Analytics to your overall data platform architecture. We won’t do a deep dive to technical implementation in this post.
Synapse Analytics Architecture
Note: At the moment of writing this blog, Synapse Analytics can refer to both “Synapse Analytics (formerly SQL DW)” and “Synapse Analytics (workspace preview)” in Azure documentation. Here we are talking about unified experience in the workspace preview.
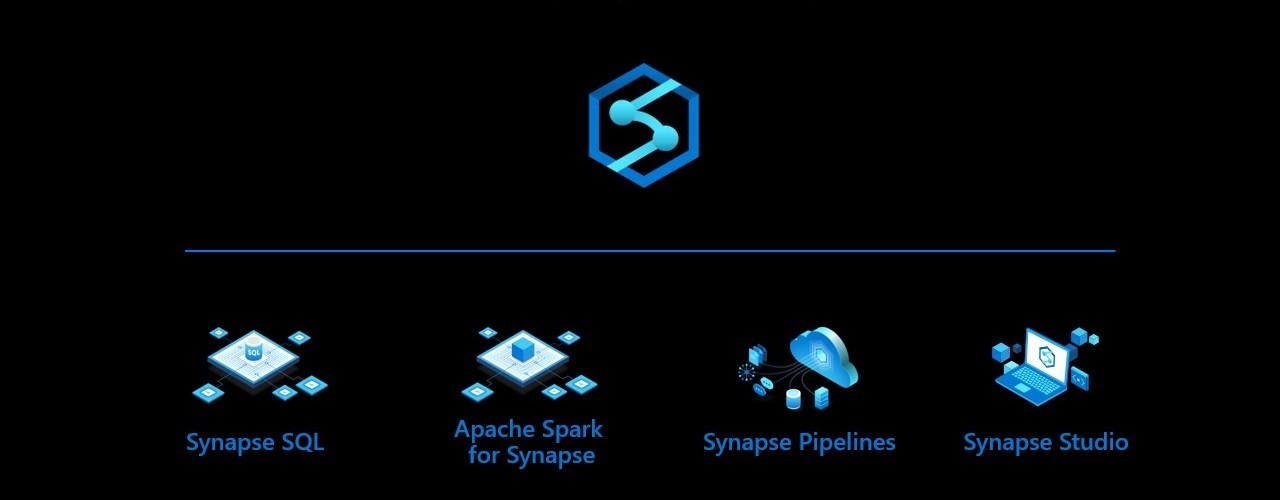
Azure Synapse Analytics is the common naming for integrated tooling providing everything from source system integration to relational databases to data science tooling to reporting data sets. Synapse Analytics contains the following
Synapse SQL
This is the data warehouse part formerly known as Azure SQL DW.
Provides both serverless (SQL on-demand) and pre-allocated (SQL Pool) resources
Shares a common metastore with the Spark engine for seamless integration
Apache Spark
Seamlessly integrated big data engine.
Shares a common metastore with Synapse SQL
Data Flow and Integrations
Shares codebase with Azure Data Factory, so has everything you expect and more
Integrate to nearly a hundred data sources to ingest data
Orchestrate SQL Procedures and Spark Notebooks
Management and Monitoring
Familiar management and monitoring tools from Azure Data Factory are available.
Synapse Studio
Single web UI where you can create everything:
Integrate to source systems
Land data to Azure Data Lake
Explore the data using Spark notebooks
Load data to Synapse SQL using T-SQL scripts
Predict what needs predicting using Python, Scala C# or SQL in Spark
Publish data sets to Power BI
Manage and orchestrate everything with pipelines
In conclusion, Synapse Analytics refers to all of the capabilities available to you and not a single included tool. Synapse SQL, as the name suggests, is perhaps the most recognizable part with the SQL DW and T-SQL. However, Synapse Analytics also contains a serverless SQL form factor named SQL On-demand. So using T-SQL no longer requires a provisioned SQL Pool.
Synapse Analytics Unique value proposal
By unifying all of the tools mentioned above, Synapse Analytics really brings something new to the table. Using Synapse Analytics you can, without ever leaving the Synapse Studio, connect to a new on-premises data source, extract, load and transform that data to Data Lake and Synapse SQL, enrich it further with ML models, and provide it for reporting usage.
Synapse Analytics provides capabilities for each of the steps in a data pipeline: ingestion, preparing data, storing, exploring, transforming and serving the data:
Ingest
If you have previously used Azure Data Factory, you will be right at home using the data integration tools in Synapse Analytics. Synapse Analytics even shares the same codebase with Data Factory, so everything you have grown accustomed to is already there (almost everything, you can check the complete differences from https://docs.microsoft.com/en-us/azure/synapse-analytics/data-integration/concepts-data-factory-differences). You can use an Integration Runtime running inside your on-premises network to access all your data sources inside your network, or an Azure hosted one for massive scale. The list of natively supported systems is constantly growing, and you can find up-to-date information from https://docs.microsoft.com/en-us/azure/data-factory/copy-activity-overview#supported-data-stores-and-formats. And if your source system is not on the list, you can always use a self hosted integration runtime with ODBC or JDBC drivers.
Despite their similarities, there’s currently no tooling to migrate ADF pipelines to Synapse Analytics Pipelines, and you can’t use the same Integration Runtime for both ADF and Synapse Analytics.
Another interesting preview feature is Azure Synapse Link. It allows you to run analytical workloads on top of operational data in Azure Cosmos DB near real time without affecting the operational usage. This means that application data in Cosmos DB is available for Synapse SQL and Spark using cloud native HTAP without building ETL workflows. https://docs.microsoft.com/en-us/azure/cosmos-db/configure-synapse-link
Prepare
After connecting to your data source, you can extract your data to Azure. There are numerous ways to organize the data in the data lake. Generally, you’ll probably want to have the original untouched data in a “raw” area, and processed and more refined data in another area.
With the new COPY INTO T-SQL command, you can use gzipped csv format to reduce the storage footprint. If using csvs, it is advisable to split large files into smaller ones, depending on your DWU capacity. And finally, you don’t have to worry about the 1 MB row limit and hard coded separator values as with PolyBase.
To really leverage all the possibilities of Synapse Analytics, you should use the parquet format in your data lake. In addition to being a compressed format, using parquet supports predicate pushdown in Synapse SQL and Spark. This greatly speeds up your exploratory queries to data lake from Synapse SQL or Spark, as you don’t have to read all the files from a given folder structure to get the rows you want. With parquet, the COPY INTO command automatically splits your files to speed up the processing.
Using Data Flows to clean and unify your data
Data Flows provide a no-code approach to transforming your data. As integrations, Data Flows are also already familiar from Azure Data Factory. With Data Flows, you could for example combine a few columns, delete a redundant one, calculate a working unique identifier and join the data with another flow before storing back to Data Lake as a processed file and also persisting it to SQL Pool table.
Explore data
Synapse Studio gives you multiple options to explore your data. We can graphically view the data lake structure, and easily get a SQL script or Spark Notebook to view the file contents just by right clicking a file.
With SQL On-demand, you can explore the contents of files without moving or importing them anywhere, and generate simple graphs in Synapse Studio UI to give you an idea of what you are looking at.
Synapse SQL, both on-demand and provisioned can be connected outside Synapse Studio with different clients using application protocols like ODBC, JDBC and ADO.NET.
In Apache Spark (example in Scala), using data from the SQL Pool is as easy as:
%%spark
val df = spark.read.sqlanalytics("SQLPool.schema.table")
This doesn’t require any configurations on Spark’s side, as the Spark and SQL are just two different runtimes operating on the same metadata and data sources.
Transform and enrich data
For transforming and enrichment, Synapse Analytics offers Spark Notebooks in addition to T-SQL. However, it has already been pretty easy to add Databricks notebooks as a part of your Azure Data Factory pipelines. With Synapse Analytics, again this integration is a bit more ready-made and easier.
One interesting possibility is SQL On-demand and it’s external tables. SQL On-demand doesn’t get access to SQL Pool’s tables (as you don’t even need to provision a SQL Pool or Synapse SQL to use SQL On-demand), but you can create external tables using T-SQL. External tables are stored as parquet backed files in Azure Data Lake Storage Gen 2. Compared to the current Azure General Availability offering, moving towards SQL On-demand and external tables in your transformations, offers serverless and fully scalable architecture. What’s the performance of external tables and SQL On-demand is going to be like, remains to be seen.
Serve
Synapse Analytics offers a few new interesting features for serving enriched data: SQL On-demand and Power BI Service connection.
With SQL On-demand, it is possible to create a highly scalable data pipeline all the way from source systems to transforming and storing data to serving it to Power BI, without any predetermined service level or capacity choices:
Ingest and Transform data using Data Pipelines and Data Flow. Use SQL On-demand or Data Flow as a part of your pipeline where needed
Store the results with “CETAS”, a T-SQL command CREATE EXTERNAL TABLE AS SELECT to store the results of your final SELECT statement to Azure Data Lake Storage Gen 2
Create a data set in Power BI. You can either use the files directly or use Direct Query via SQL On-demand.
Lastly, Synapse Analytics has the capability to link to Power BI Service! You can create linked services with Power BI Workspaces, view datasets and also create Power BI reports without ever leaving Synapse Studio. This greatly simplifies the process of creating reports from new data.
Do note that at the moment, you can only link to ONE Power BI Workspace. After connecting to a Power BI Workspace, you can create new Power BI reports based on published data sets without leaving Synapse Studio.
Manage and orchestrate
For orchestrating your pipelines, Synapse Analytics offers pretty much the same tooling as Azure Data Factory. You can easily combine your Data Flows, Spark Notebooks, T-SQL queries and everything to form pipelines as in Azure Data Factory. The familiar triggers are also there.
Management views also share much of the same as Azure Data Factory.
Synapse Analytics excels
Synapse Analytics strengths lie in it’s unified and yet versatile tooling.
Starting a new data platform project
Synapse Analytics offers an unified experience creating ingestion, preparation, transformations and serving your data in one place
Architecture with Data Lake
Synapse Analytics’s unified tooling makes it easier to work with and explore Data Lake
Architecture with Cosmos DB (or other future possible Synapse Link sources)
Near-real-time analytics based on operative data sources without any manual ETL processes
Explorative work on unknown data
Many tools and languages in one place
Security management in Synapse Workspace
Instead of setting up and configuring multiple separate tools with authentications and networks between them, you have only the Synapse Analytics workspace to setup
Possibility for both no-code and code approaches
A suitable approach probably exists for many developers to get started
Synapse SQL Pool as an MPP database
Synapse SQL is a powerful database in it’s own right
What we wish to see in future updates
While Synapse SQL Pool does pack a punch, it does require dba work and manual maintenance. Maybe more automation regarding this in the future?
Different indexes, partitions and distributions will have an impact on performance and storage costs
Workload management: classification, importance, isolation all need to be planned for and addressed for full scale operations
More dynamic resource scaling
Scaling Synapse SQL is an offline operation
While SQL On-demand offers some exciting possibilities, it fails to deliver any database functionalities: no access to relational tables for example as it doesn’t require a SQL Pool. There are parquet backed external tables, but their performance remains to be seen
Development in the Spark-sector as Synapse’s Spark is not on par with Databricks
For example, one notebook locks one Spark pool
Different runtime versions compared to Databricks
Implementation of version control
There’s no GIT or any other version control system support. The only way to save work is to publish, which also makes it visible to all other developers.
Managing different environments without version control system requires the use of SDK or APIs, which means a lot of work to get production ready
Getting from preview to GA
There still are instabilities and UI issues. The usual Preview shenanigans which are hopefully taken care of before moving to general availability.
Conclusion
In conclusion, Synapse Analytics’s vision is a great one: unified tool and experience to create almost everything you require in Azure to get your data from a data source to a published report. At the moment, there are some drawbacks as the whole workspace experience is still in preview, of which the lack of version control is definitely not the smallest.
At this point, we haven’t made any performance analysis and it is too early to say, if Synapse Analytics can really be a silver bullet for combining data pipelines, warehousing and analytics. In addition to performance, some key unique features are somewhat handicapped at this point: for example you can only connect to one Power BI Workspace. The vision is definitely there, and we will be anxiously waiting for future updates.
Target audience are data practitioners looking for a method to practice DataOps with a simple method even in restricted environments. A walk-through of the code is detailed in the appendix.
The linked code repository contains a minimal setup to automatize infrastructure and code deployment simultaneously from Azure DevOps Git Repositories to Databricks.
TL;DR:
Import the repo into a fresh Azure DevOps Project,
get a secret access token from your Databricks Workspace,
paste the token and the Databricks URL into a Azure DevOps Library’s variable group named “databricks_cli”,
Create and run two pipelines referencing the YAML in the repo’s pipelines/ directory.
Any Databricks compatible (Python, Scala, R) code pushed to the remote repository’s workspace/ directory will be copied to the Databricks workspace with an interactive cluster waiting to execute it.
Background
Azure DevOps and Databricks have one thing in common – providing industry standard technology and offering them as an intuitive, managed platform:
Databricks for running Apache Spark
DevOps for Git repos and build pipelines
Both platforms have much more to offer then what is used in this minimal integration example. DevOps offers wiki, bug-, task- and issue tracking, canban, scrum and workflow functionality among others.
Databricks is a fully managed and optimized Apache Spark PaaS. It can natively execute Scala, Python, PySpark, R, SparkR, SQL and Bash code; some cluster types have Tensorflow installed and configured (inclusive GPU drivers). Integration of the H2O machine learning platform is quite straight forward. In essence Databricks is a highly performant general purpose data science and engineering platform which tackles virtually any challenge in the Big Data universe.
Both have free tiers and a pay-as-you-go pricing model.
Databricks provides infrastructure as code. A few lines of JSON consistently deploy an optimized Apache Spark runtime.
After several projects and the increasing need to build and prototype in a managed and reproducible way the DevOps-Databricks combination became very appreciated: It enables quick and responsive interactive runtimes and provides best industry practice for software development and data engineering. Deployment into (scheduled), performant, resilient production environments is possible without changes to the platform and without any need for refactoring.
The core of the integration uses Databricks infrastructure-as-code (IaC) capability together with DevOps pipelines functionality to deploy any kind of code.
the Databricks CLI facilitates programmatic access to Databricks and
the managed Build Agents in DevOps deploy both infrastructure and analytic code.
Azure pipelines deploy both the infrastructure code and the notebook code from the repository to the Databricks workspace. This enables version control of both the runtime and the code in one compact, responsive repository.
All pieces of the integration are hosted in a single, compact repository which make all parts of a data and modeling pipeline fully reproducible.
Prerequisites
Log into Azure DevOps and Databricks Workspace. There are free tiers for both of them. Setup details are explained extensively in the canonical quick start sections of either service:
For the integration Databricks can be hosted in either the Azure or AWS cloud.
1. Import the Repository
To use this demo as a starting point for a new project, prepare a Azure DevOps project:
create a new project (with an empty repository by default)
select the repository tab and choose “Import a repository”
paste the URL of this demo into the Clone URL field: https://dev.azure.com/reinhardseifert/DatabricksDevOps/_git/DatabricksDevOps
wait for the import to complete
clone the newly imported repository to your local computer to start deploying your own code into the workspace directory
Then create two Azure pipelines which create the runtime and sync any code updates into it (see below).
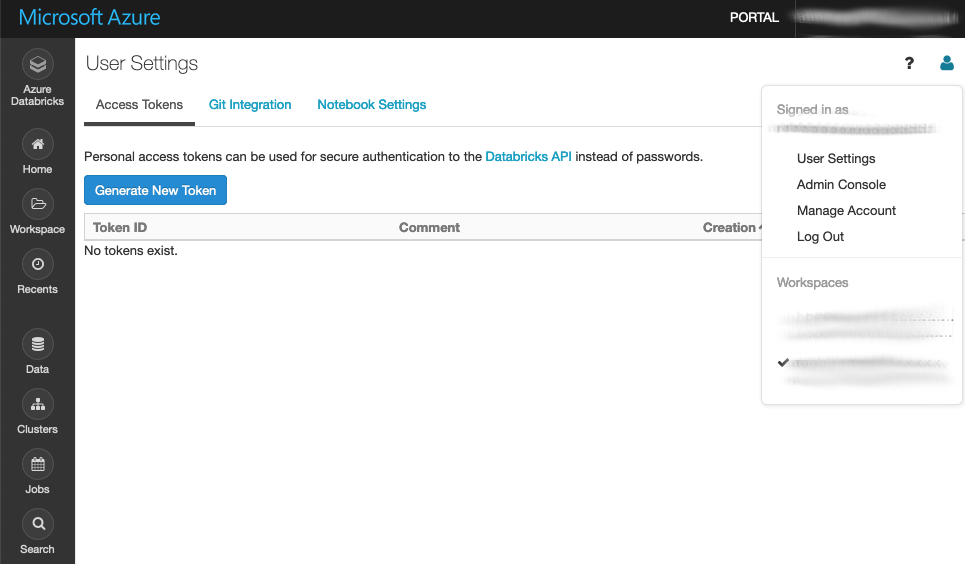
2. Create Databricks Secret Token
Log into the Databricks Workspace and under User settings (icon in the top right corner) and select “Generate New Token”. Choose a descriptive name (“DevOps Build Agent Key”) and copy the token to a notebook or clipboard. The token is displayed just once – directly after creation; you can create as many tokens as you wish.
Databricks > User Settings > Create New Token
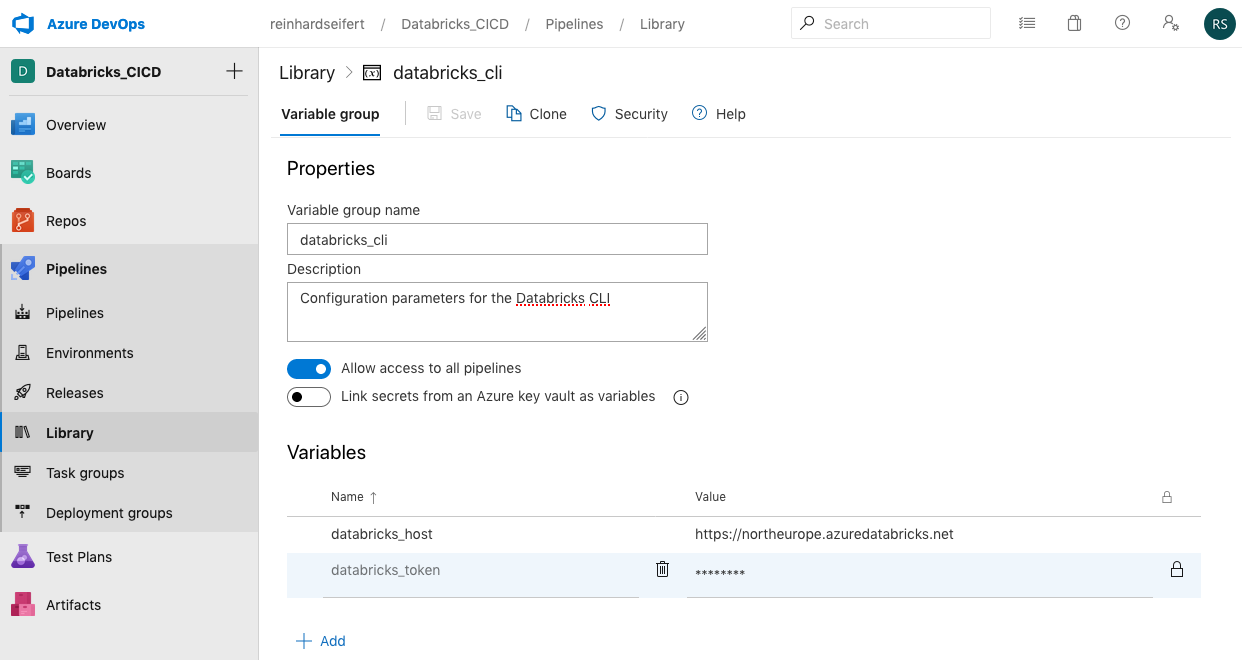
3. Add the token to the Azure DevOps Library
The Databricks Secret Token has to be added to a Variable Group named “databricks_cli”. Variable groups are created under Pipelines > Library. Note that the name of the variable group is referenced in both pipeline definitions (/pipelines/build-cluster.yml and /pipelines/build-workspace.yml). Two variables have to be defined: 1. databricks_host and 2. databricks_token
The variable names are referenced in the .yml file – changing them in the DevOps library requires also changing them correspondingly in the .yml files. When clicking the lock icon after defining the variable it is treated as a secret and not visible after that action in the DevOps project. Neither in the Library nor in the Build servers (even when accidentially echo-ing them. But of course writing them to the Databricks environment would potentially expose them. This is a security concern when collaborating with non-trusted parties on a Project.
Pipelines > Library > Add Variable Group
Azure DevOps
Generally the Azure DevOps portal offers as minimal functionality a git repository to maintain code and pipelines to deploy the code from the repository into runtimes.
Azure Repositories
The Azure repo contains the full logic of the integration:
the actual (Python) code to run,
the JSON specification of the Spark-cluster which will run the code,
shell build scripts which are executed in the pipeline/ build server,
the YAML configuration which define the pipelines.
The complete CI/CD pipeline is contained in a single Git repository in a very compact fashion. Following Databricks’ terminology the Python code (1) is located in the workspace/ directory. The runtime specification .json (2), build scripts .sh (3) and the pipeline configuration .yml (4) are located in the pipelines/ directory according to the Azure DevOps paradigm.
Azure Pipelines
The Pipelines menu provides the following functionality:
Pipelines (aka build pipelines),
Environments (needed to group Azure resources – not used here),
Releases (aka release pipelines – not used here)
Library (containing the variable groups)
The build pipelines exclusively used in this demo project are managed under the “Pipelines > Pipelines” menu tab – not really intuitive.
Azure Build Pipelines
The pipeline’s build agents are configured via YAML files (e.g. build-cluster.yml). In this case they install the Databricks CLI on the build machine and then execute CLI commands to create runtimes and move code notebooks to the runtime. The Databricks cluster is configured by a single JSON file (see config.cluster.json).
This minimal integration requires creation of two pipelines:
cluster creation – referencing pipelines/build-cluster.yml and
select the imported repository from the drop-down menu
select Existing Azure Pipeline YAML file
select the YAML file from the drop-down menu
Run the pipeline for the first time – or just save it and run it later.
At this point the Databricks secret access token mentioned in the prerequisite paragraph need to be present in a “databricks_cli” variable group. Otherwise the pipeline run will fail and warn; in this case just create the token (in Databricks) and the variable group (in DevOps) and re-run the pipeline.
After creating the pipelines and saving them (or running them initially), the default pipeline names reference the source repository name which triggers them. For easier monitoring the pipelines should be renamed according to their function, like “create-cluster” and “sync-workspace” in this case.
Summary
This concludes the integration of analytic code from an Azure DevOps repository into a hosted Databricks runtime.
Any change to the config.cluster.json deletes the existing cluster and creates a new one according to the specifications in the JSON file.
Any change to workspace/ will copy the notebook file(s) (R, Python, Scala) to the Databricks workspace for execution on the cluster.
The Databricks workspace in this example was hosted on Azure. Only minor changes are required to use an AWS hosted workspace. On all cloud platforms the host URL and security token is specific for the chosen instance and region. The cloud specific parameter is the node_type_id in the cluster configuration .json file.
Using this skeleton repo as a starting point, it is immediately possible to run interactive workloads on a performant Apacke Spark cloud cluster – instead of “cooking” the local laptop with analytic code – transparently maintained on a professional DevOps platform.
Appendix
Following, a detailed walk-through of the .yml pipeline configurations, .sh build scripts and .json configuration files.
In general, the YAML instructs the build server to 1. start up when a certain file is changed (trigger), 2. copy the contents of the repository to the build server and 3. execute a selection of shell scripts (tasks) from the repository
Pipeline: Create cluster
This is a detailed walk through for the build-cluster.yml pipeline. The .yml files have a hierachical structure and the full hierarchy of the DevOps build pipeline is included although stages could be omitted.
Trigger
The first section of the pipeline YAML specifies the trigger. Any changes to the specified branch of the linked repo will automatically run of the Build Agent.
Without the paths: section, any change to the master branch will run the pipeline. The cluster is rebuild when the configuration changes or the selection of installed Python- or R-libraries changes.
Stages
The stage can be omitted (for a single stage pipeline) and the pool, variables and jobs directly defined. Then the stage would be implicit. It is possible to add testing steps to the pipeline and build fully automated CI/CD pipelines accross environments within on .yml file.
Selects the type of virtual machine to start when the trigger files are changed. At the time of writing ubuntu_latest will start a Ubuntu 18.04 LTS image.
Variables
variables:-group: databricks_cli
This section references the variable group created in the Prerequisite section. The secret token is transfered to the build server and authorizes the API calls from the server to the Databricks workspace.
Jobs, Steps and Tasks
A job is a sequence of steps which are executed on the build server (pool). In this pipeline only task steps are used (see the docs for all step operations).
The first step is selecting the Python version for all following Python command on the build server; the Databricks CLI is written in Python and installed via Pip in the following task.
Task: Install and configure the Databricks CLI
        - task: ShellScript@2
          inputs:
            scriptPath: pipelines/databricks-cli-config.sh
            args: "\$(databricks_host) \$(databricks\_token)"
          displayName: "Install and configure the Databricks CLI"
Note that the path is relative to the root of the repo. The secret access token and host URL from the DevOps library are copied into environment variables which can be passed to the script in the args section.
The shell script executes the installation of the Databricks CLI and writes the neccessary CLI configuration on the build server.
Task: “Delete previous cluster version (if existing)”
This task will remove any cluster with the name provided in the args: section. This allows for updating the cluster when the configuration file is changed. When no such cluster is present the script will fail. Usually the pipeline will break at this point but here continueOnError is true, so the pipeline will continue when creating a cluster for the first time.
-task: ShellScript@2inputs:scriptPath: pipelines/databricks-cluster-delete.shargs:"HelloCluster"continueOnError:"true"displayName:"Delete previous cluster version (if existing)"
The shell script called by this task is a wrapper around the Databricks CLI. First it queries for the cluster-id of any cluster with the name passed.
CLUSTER_ID=$(databricks clusters list --output json |jq -r --arg N "$CLUSTER_NAME"'.clusters[] | select(.cluster_name == $N) | .cluster_id')
It is possible to create multiple clusters with the same name. In case there are multiple all of them are deleted.
forID in $CLUSTER_IDdoecho"Deleting $ID"databricks clusters permanent-delete --cluster-id $IDdone
Task: Create new cluster
-task: ShellScript@2inputs:scriptPath: pipelines/databricks-cluster-create.shargs:"HelloCluster"displayName:"Create new cluster"
The build script reads the config.cluster.json and adds the cluster name passed from the pipeline .yml
Now the configuration .json file can be passed to the Databricks CLI. The complete Apache Spark infrastructure is configured in the json. CLUSTER_NAME will be replaced with the name passed from the .yml.
Updating the runtime to another version requires only modifying the spark_version parameter with any supported runtime.
A Spark cluster consists of one driver node and a number of worker nodes and can be scaled horizontally by adding nodes (num_workers) or vertically by choosing larger node types. The node types are cloud provider specific. The Standard_DS3_v2 node type id references the minimal Azure node.
The autotermination feature shuts the cluster down when not in use. Costs are billed per second up time per processing unit.
Any reconfigurations triggers the pipeline and rebuilds the cluster.
The cluster create call returns the cluster-id of the newly created instance. Since the last step of this pipeline installs additional Python and R libraries (via Pip and CRAN respectively) it is necessary to wait for the cluster to be in pending state.
STATE=$(databricks clusters list --output json |jq -r --arg I "$CLUSTER_ID"'.clusters[] | select(.cluster_id == $I) | .state')echo"Wait for cluster to be PENDING"while [["$STATE"!="PENDING" ]]doSTATE=$(databricks clusters list --output json |jq -r --arg I "$CLUSTER_ID"'.clusters[] | select(.cluster_name == $I) | .state')done
Task: Install Python and R dependencies on the cluster
The final step is to add additional Python and R packages to the cluster. There are many ways to install packges in Databricks. This is just one way to do it.
-task: ShellScript@2inputs:scriptPath: pipelines/databricks-library-install.shargs:"HelloCluster"displayName:"Install Python and R dependencies"
Again the shell script wraps the Databricks CLI, here the library install command. The cluster name (“DemoCluster” in this example) has to be passed again.
All CLI calls to Databricks need the cluster-id to delete, create and manupulate instances. So first fetch it with a cluster list call:
CLUSTER_ID=$(databricks clusters list --output json |jq -r --arg N "$CLUSTER_NAME"'.clusters[] | select(.cluster_name == $N) | .cluster_id')
Then install the packages – one call to library install per package:
For additional Python or R package add a line in this build script – this will trigger the pipeline and the cluster is rebuild.
Pipeline: Import workspace
This is a detailed walk through for the build-workspace.yml pipeline. The first part of the pipeline is identical to the build-cluster.yml pipeline. The trigger include differs, since this pipeline is triggered by code pushes to the workspace/ directory. The choice of the build server (pool), the variable reference to the databricks_cli variable group for the Databricks access tokens and the Python version task are identical, also installing and configuring the Databricks CLI with the same build script as above.
The only build task is importing all files in the workspace/ directory to the Databricks Workspace. The args passes a sub-directory name for the /Shared/ folder in Databricks ( /Shared/HelloWorkspace/ in the example).
-task: ShellScript@2inputs:scriptPath: pipelines/databricks-workspace-import.shargs:"HelloWorkspace"displayName:"Import updated notebooks to workspace to dev"
The specified directory is first deleted. When the directory does not exist, the CLI prints and error in JSON format, but does not break the pipeline. The args: parameter is passed to the $SUBDIR variable in the build script.
Remember that the repo is copied into the pipeline build agent/server and the working directory of the pipeline agent points to the location of the .yml file which defines the pipeline.
Power BI provides easy and readily available tools for report creation and distribution. However, distributing reports outside Power BI Service and to users without Power BI Pro account is limited. Say you have a Power BI report monitoring your Snowflake account usage (https://data.solita.fi/visualize-snowflake-warehouse-cost-using-power-bi/), and you’d like to share that to the development and maintenance team. You don’t want to purchase Power BI Pro licenses and you don’t want to open the report to the whole world. Instead you simply want to show your PBI report on a web page / in your intranet, where users can securely access it – and here’s where Power BI Embedded and Azure Web Apps come in handy!
In this blog post we’ll set up an environment with a Web App, and use a service principal (whose identity we’ll retrieve from Azure Key Vault) to access Power BI Service to retrieve a report for Embedding. All the work will result in a template that is easy to copy for new web applications to embed new reports. We’ll also take a look at some handy modifications to our Web App template for retrieving a desired report page and hiding navigation elements. You don’t need to be familiar with .NET, we’ll be doing only slight modifications to an existing Microsoft template!
Environment
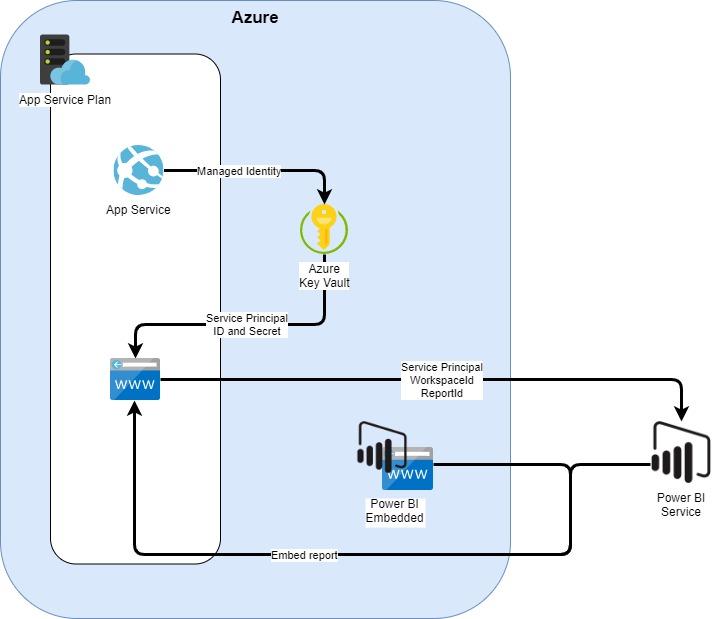
Target environment is presented in the picture below. The goal is to setup the environment in a way that it is easily reusable: for example adding a few more web applications with other reports embedded in them shouldn’t be too much of a trouble.
Power BI Embedded and Web App environment
App Service Plan
Azure App Service Plan provides a pool of resources for App Services running inside the Plan. You can view it a bit like a server farm in old on-premises systems. The main decisions to make are your App Service Plan location (West Europe, US East, etc…) and the amount and level of resources available inside that Plan: number and size of instances, pricing tier. Start small when developing and scale up as required. As always, refer to Azure documentation for up-to-date information on different service levels: https://docs.microsoft.com/en-us/azure/app-service/overview-hosting-plans
App Service
Azure App Service provides infrastructure for a single application inside an App Service Plan. Each App Service receives a URL pointing to that particular App Service: for example https://ourprojectsnowflakemonitoring.azurewebsites.net. Our embedded report is a web application running in App Service. We’ll be using App Service managed identity to identify our application to Azure Key Vault. And lastly we can use App Service network configurations to restrict access to our application.
Web application
A web application running in Azure App Service can be written in a number of languages. We’ll be using a template provided by Microsoft from https://github.com/microsoft/PowerBI-Developer-Samples/tree/master/App%20Owns%20Data. We’ll modify the template so that we can retrieve configurations from Azure Key Vault, namely our Service Principal information. We will also use application settings so we can easily copy our web app for new embedded reports.
Azure Key Vault
Key Vault provides a secure place for accessing and storing secrets. In this example, we’ll be storing our Service Principal credentials there, and allowing access to our App Service.
Service Principal
Service Principal can be seen as a technical account in Azure AD. It offers a way to authenticate as a service, not as a user. Using Service Principals to authenticate your applications to Power BI Service is a more scalable way: say you have multiple workspaces and multiple applications using the reports: creating, managing and authorising multiple service principals is simpler than multiple “Master Users”. For much more detailed documentation, please refer to https://docs.microsoft.com/en-us/power-bi/developer/embed-service-principal.
Power BI Embedded
Power BI Embedded provides Power BI capacity outside Power BI Service. We can setup workspaces to use the Embedded capacity and provide the reports to outside users via web apps. Power BI Embedded comes in three capacities: A for capacity in Azure, EM for volume licensing, and P for Premium licence. Unless you already have volume licensing or Premium capacity, you would most probably want to use A capacity bought from Azure.
Power BI Service, Workspace and Report
The Embedded report resides as usual in Power BI Service in a Workspace that is assigned to use Embedded capacity. As we are using Service Principal, our Workspace needs to be V2, and we need to allow Service Principals to use it.
Environment setup
Terraform
I’m used to creating my environments using Terraform (https://www.terraform.io/). There’s a lot of blog posts out there discussing why you should or shouldn’t use Terraform in Azure. I personally like the easy readability and reusability of it.
Using Terraform in Azure and setting up a CI/CD pipeline from Azure DevOps is a topic for another blog post. Here, we’ll focus more on setting up our environment and the different configurations we require. So don’t worry right now about the Terraform syntax, let’s focus more on the output.
We are creating an App Service Plan sized D1 and Shared tier. This is suitable for development and testing.
Then we add an App Service to previously created App Service Plan. We set the App Service to get a “System Assigned” identity. Using SystemAssigned identity, our newly created web app receives an Azure AD identity which we then authorize to access Azure Key Vault to retrieve Service Principal Secrets. This way we don’t have to authorize anything else (for example another service principal) besides the application itself to retrieve the secret.
We also set an app_settings block. These are application configurations, which will override the configurations set in code. These will become handy later on.
Creating a key vault is pretty straight forward. What is special here is that we grant “get” and “list” permissions to the system assigned identity of our App Service: the tenant_id and object_id are dynamically referencing the corresponding outputs of the system assigned identity. No need to hardcode anything.
Remember to restrict access to your web app if required. For example, restrict access to only your offices’ and vpn’s IPs.
Service Principal
Next, we need a service principal. Service principal is a technical account which accesses Power BI Service and REST APIs. It doesn’t require any licenses and it can’t login via app.powerbi.com. More info about Service Principal in Power BI Embedded context can be found from https://docs.microsoft.com/en-us/power-bi/developer/embed-service-principal.
Here the actual values are retrieved from another place. We don’t want to store sensitive information in plaintext in Terraform.
Power BI Service and Workspace
Setting up a Power BI Embedded can be a bit of a hassle and documentation is spread around. A more complete guide is a topic of it’s own blog post, so here’s a short summary of what needs to be done:
Create Power BI Embedded capacity in Azure. That means A-tier capacity (P-tier is for Premium, and EM for volume licensing). Note that Embedded capacity should be in the same region as your Power BI Service is. Don’t forget to add capacity admin.
Add Embedded capacity to your Power BI Service
Assign a Workspace V2 to Embedded capacity. As we are using Service Principals, we need to use a Workspaces V2.
Allow Service Principals in Tenant settings
Allow service principals in the Workspace with your Reports you want to Embed.
Power BI Report for Embedding
Now that everything else is ready we still need the actual report and the web page to display and embed the report. The embedded report resides as usual in Power BI Service, published in our Workspace V2 added to Embedded capacity.
Open your report, and publish it to the correct workspace. Note that you will need a Power BI Pro license to do so.
After publishing, the parameters we require for embedding are Report and Workspace Id. These you can retrieve from your published report. Open your report and look at the url:
Here the part after “groups/” is your workspace ID. The part after “reports/” is your report ID.
You might remember we had an app settings block in our web app:
Now we have empty web app capacity which has access to Azure Key Vault to retrieve Service Principal ID and secret in order to access our Power BI. All that is left is the web application itself.
Web App
Our web app will be a simple web page which shows the report from Power BI. We’ll be using the template with no further authentication. The template is called “app owns data”. It is advisable to restrict web app access to your office IPs for example.
Download a copy of the project, and open up the PowerBIEmbedded_AppOwnsData.sln in Visual Studio. The template requires some modifications:
Reference the Key Vault for secrets
Use the Key Vault as a source for configurations
Besides Key Vault, we’ll also use application settings (set before, report ID and workspace ID) as a source for configurations. This happens automatically, and doesn’t require any modifications.
Setup Azure Key Vault
Let’s add our Key Vault as a connected service:
Select the Key Vault we just created. Note, you might need to add access rights to yourself depending on your setup!
Use Key Vault as a source for configurations
Update and add NuGet packages:
You’ll want to update the already existing packages. We also need to add one NuGet package in order for us to use Azure Key Vault as a config source. Add NuGet package:
Now we want to modify our configurations. Open the web.config file. At the start of the file, add configBuilders section (modify “yourkeyvaultname” to match your keyvault). Also add configBuilders=”AzureKeyVault” to appSettings block.
For local debugging, you can add workspaceId and reportId. However, the app_settings values we previously set for web application in Azure will override anything you set in here.
    <!-- Fill Tenant ID in authorityUrl-->
    <add key="authorityUrl" value="https://login.microsoftonline.com/common/f4nnnnn-nnnn-nnnn-nnnn-nnnnnnnnnnnn" />
You need to add empty key-value pairs for every Key Vault secret you want to import! Let’s say our ServicePrincipal secret is called “servicePrincipalClientSecret”. To import it, we need to add the following line in app settings:
The actual values are fetched from Azure Key Vault.
Use configuration values in our application
Check what configuration values map to what values in application: Modify Services/EmbedService.cs In our example, we need to configure ApplicationSecret to point to servicePrincipalClientSecret, and ApplicationId to point to servicePrincipalClientId. This is at the very start of the file:
A web page should open. Click on Embed report, and it should open a report for you!
And that’s it! You’ve successfully set-up a Web App, which connects to a Key Vault using a managed identity, to get client secrets, and then uses those secrets to identify as a Service Principal to Embed a Power BI report to your web page! That was a mouthful; in other words, you are using application specific secrets the correct way and not some hard-coded human-impersonating Power BI account.
Publish our Web App
All that is left is to publish our web app:
Let’s use our previously created web app:
Click OK and then publish, and you are good to go! You might want restrict access to your web app only to your office and vpn IPs.
Some modifications
Disable filter and navigation panes from report
Say you are showing your report in a non-interactive way (a TV screen for example). You might want hide redundant filter and navigation panes from the view:
Modify Views/Home/EmbedReport.cshtml. Find the following:
You have a nice report showing on your TV with navigations and filters disabled. Nice. Now you’d like to show different pages from that report based on a URL.
Modify Controllers/HomeController.cs
Add ReportPage to EmbedReport:
public async Task<ActionResult> EmbedReport(string username, string roles, int ReportPage = 0)
The zero in ReportPage means that by default we’ll open the first page.
Modify Views/Home/EmbedReport.cshtml.
Change the end of the file from:
    // Embed the report and display it within the div container.
    var report = powerbi.embed(reportContainer, config);
To
    // Get a reference to the embedded report HTML element
    var reportContainer = $('#embedContainer')[0];

    // call load() instead of embed() to load the report while delaying the rendering process
    var report = powerbi.load(embedContainer, config);

    // when loaded event occurs, set current page then call render()
    report.on("loaded", function () {
       // console.log("loaded event executing");
        // call to get Pages collection
        report.getPages().then(
            function (pages) {
                // inspect pages in browser console
                //console.log(pages);
                // display specific page in report
                var startPage = pages[@ViewBag.ReportPage];
                config.pageName = startPage.name;
                // Call report.render() to display report
                report.render(config);
            });
    });
Now you can set the report page in the URL. Use ReportPage=<page_number_starting_from_0> as the parameter: For example “EmbedReport?ReportPage=1” would take you to the second page.
Further customization:
Embed container size and other style related: Content/style/style.css
It is possible to require users to authenticate to your Azure AD: this option is called “users’ own data” and the template is found from the same GitHub repo as our app own data example.
Publishing a new report
Now that we have a working template, publishing a new web app pointing to a new report is extremely fast and easy.
Get your new report’s report ID. Use the same workspace, or remember to add the service principal to the new Power BI workspace.
Create a new web application in Azure. It’s just copying in your Terraform: Update the reportId and workspaceId, add key vault access policy. Here we are creating a new web app called “Solita-blog-datapipeline-monitor”.
Copy our web application solution.
Open the new copy, and publish it to the new web app in Azure.
You now know what kind of environment you need to securely use Web App, Power BI Service and Power BI Embedded in Azure. You know how to do some modifications to your web app or at least where to look for more information. And after the first application, publishing a new one is just a simple matter of creating a new copy with two new parameter values.
After working with Power BI Embedded for a while I’ve grown to appreciate it’s capabilities. This was just about embedding a complete report from Power BI Service, and I’m looking forward to do some more complex work combining web applications with Power BI Embedded!
In this following blog-post, I will tell you how to create asynchronous replication from Microsoft Active Directory to Snowflake Cloud Data Warehouse so you can use your existing AD users and groups (including nested groups) to manage Snowflake.
Kirjoittaja:Mika Heino Data Architect, Snowflake Tech Lead
I’ve been using Snowflake for a few years now and although Snowflake is an excellent product, it lacks the possibility to use existing directories (Microsoft Active Directory, OpenLDAP, Google) for managing Snowflake users and roles. It doesn’t though mean that it’s impossible.
As of today, you can already create federated authentication against Okta, ADFS, or another (i.e. custom) SAML 2.0-compliant Identity Provider (IdP) which enables users to do a single sign-on into Snowflake using their (for example) Azure Active Directory information. We’ll come back to this later on, as federated authentication is a key piece for using AD accounts with Snowflake.
In this following blog-post, I will tell you how to use and sync Microsoft Active Directory -users and groups into Snowflake and what components are needed for this. Let’s start by going through the needs.
You’ll need following for making the synchronization possible:
1) Rights to modify Snowflake account parameters and create new users
2) Microsoft Azure -subscription for enabling AzureAD Single Sign-On to Snowflake
3) Windows Server connected to Active Directory and snowsql installed
4) This script which sync’s users from AD. Huge thanks to James Weakley.
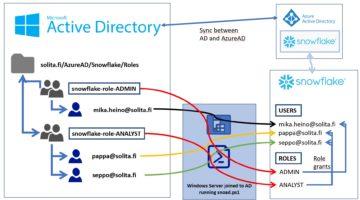
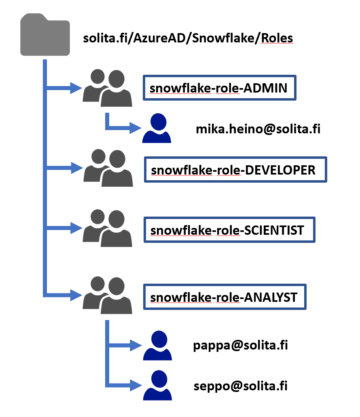
We will create following linking between Snowflake, Azure and Microsoft Active Directory.
Idea is to create a similar structure within Active Directory as you want to have inside Snowflake. Users and groups are provisioned and synced into Snowflake using Powershell -script running inside Window Server joined into AD. Single Sign-On authentication happens against AzureAD. So, let’s start configuring.
Enabling Single Sign-On
Steps can be created in any order, but you can start by enabling single sign-on as a first step. Having single sign-on enabled, you can already start using AD accounts as long as you create the needed accounts manually. Enabling single sign-on is already documented really well by Microsoft in the following site. https://docs.microsoft.com/en-us/azure/active-directory/saas-apps/snowflake-tutorial so I won’t go through all steps. Shortly, the idea is to configure AzureAD as IdP for Snowflake and eventually configure the same in Snowflake as detailed below.
USE ROLE ACCOUNTADMIN ;

ALTER ACCOUNT SET SAML_IDENTITY_PROVIDER = '{

"certificate": "longhash",

"ssoUrl": "https://login.microsoftonline.com/hashedtext/saml2",

"type" : "ADFS",

"label" : "AzureAD"

}';
Set the login page (this the page what you see, when you log on to Snowflake) to have new button what user’s can now to log using their Active Directory account.
ALTER ACCOUNT SET SSL_LOGIN_PAGE = TRUE ;
Finally alter any desired test users to have LOGIN_NAME similar as their AD account information. This will map do the actual mapping. You may also remove the users.
ALTER USER mika.heino@solita.fi SET LOGIN_NAME = 'mika.heino@solita.fi' DISPLAY_NAME = 'Mika Heino, Solita '
Creating Snowflake service account for script use
Once you have single sing-on working and tested, we can move to automating the user and group (role) provisioning. For this, we need a separate Snowflake service account as we don’t want to run stuff with personal accounts.
Creating roles and users in Snowflake requires SECURITYADMIN role. You can either create a service account with securityadmin granted, or you can create your own security admin role for service account with the required rights. Either way is ok, as long as it’s documented properly.
For example create following user: CREATE USER S_AUTOMATION_AD_SYNC PASSWORD = 'example_password' COMMENT = 'Service Account, Used to sync Active Directory users and roles' LOGIN_NAME = 'S_AUTOMATION_AD_SYNC' DEFAULT_ROLE = "SERVICE_ACCOUNTS_SECURITYADMIN" DEFAULT_WAREHOUSE = 'WH_ADE_DEV' DEFAULT_NAMESPACE = 'PUBLIC' MUST_CHANGE_PASSWORD = FALSE ;
GRANT ROLE "SERVICE_ACCOUNTS_SECURITYADMIN" TO USER S_AUTOMATION_AD_SYNC ;
GRANT ROLE "SECURITYADMIN" TO ROLE "SERVICE_ACCOUNTS_SECURITYADMIN";
Creating OU and Snowflake role structure
Choose or create a new Organizational Unit (OU) for Snowflake users. This will be the container for roles that you can use to grant rights inside Snowflake. Although this is the most straightforward phase in the whole process, use time to consider the roles (groups) to have and use. Consider at least the following structure:
1) Limited role for persons to have ACCOUNTADMIN -rights. Keep the number of people here a limited as this role can do anything inside Snowflake -account.
2) DV_ADMIN/DEVELOPER -role. Ideally, this role will have the rights to do anything inside one or more databases and meant for the persons creating the data models and loads i.e. in Solita the persons doing the Data Vault.
3) DATA SCIENTIST -role. Ideally, this role would have the rights to read anything from all the schemas inside the database having all the business data and rights to create anything inside separate development -database.
4) ANALYST -role. This role is meant for the business users and should have read rights to Publish -schema or ideally only to dimension and facts tables having business rules applied.
Same structure inside Active Directory.
Once you have the general structure ready, create it inside Active Directory, note the OU -structure and move to next step.
Scheduling the script
Scheduling the PowerShell – script is really straight forward. You use can the trusted Task Scheduler (ideally this would be running for example inside Azure Function, but this is the first version) for scheduling. You need to have a Windows Server joined into Active Directory, snowsql -installed and necessary firewall openings done. You’ll need to provide a few details for the script. Following is an example of the details for the script.
The script will retrieve all security groups and all the users from the OU you define, check whether they exist in Snowflake and create any missing users without any password to enforce AD authentication. For each security group immediately within the OU, a role in Snowflake is matched or created and all Snowflake users are granted it. The process goes also the other way, as users who have subsequently been removed from the AD group will be revoked from the corresponding role. Detailed documentation can be found in the GitHub -projects README -file.
Following is an example from script and it will create missing roles and grant roles to correct persons. In this example script you can also see a user being removed. In Snowflake the user removal is disable and revoke of his/hers roles, but no user account deletion.
As you can see from the script, you can map the role names using prefixes so that AD role snowflake-role-ADMIN is mapped to ADROLE_ADMIN. This will also help you on creating the roles in Active Directory, as you can use the existing company naming standards.
** Retrieving list of current snowflake users

Total current Snowflake SSO users: 30

**Retrieving AD security groups in OU OU=Snowflake,OU=Solutions,DC=FI,DC=Solita,DC=int

. AD Group : snowflake-role-ADMIN

. Snowflake Role : ADROLE_ADMIN

Fetching users immediately in group whose accounts aren't disabled

Fetching users nested in non-snowflake groups under group , whose accounts aren't disabled

Fetching nested role group

. AD Group : snowflake-role-DEVELOPER

. Snowflake Role : ADROLE_DEVELOPER

Fetching users immediately in group whose accounts aren't disabled

Fetching users nested in non-snowflake groups under group , whose accounts aren't disabled

Fetching nested role group

. AD Group : snowflake-role-Scientist

. Snowflake Role : ADROLE_SCIENTIST

Fetching users immediately in group whose accounts aren't disabled

Fetching users nested in non-snowflake groups under group , whose accounts aren't disabled

Fetching nested role group

. AD Group : snowflake-role-Analyst

. Snowflake Role : ADROLE_ANALYST

Fetching users immediately in group whose accounts aren't disabled

Fetching users nested in non-snowflake groups under group , whose accounts aren't disabled

Fetching nested role group

Disabling 1 users as they have no roles mapped in AD

**Retrieving list of current snowflake roles

Checking membership of current roles

Checking role ADROLE_ADMIN exists in Snowflake

Role does not exist, creating

Checking role ADROLE_DEVELOPER exists in Snowflake

Checking role ADROLE_SCIENTIST exists in Snowflake

Checking role ADROLE_ANALYST exists in Snowflake

Role does not exist, creating

. Checking role ADROLE_ADMIN has the appropriate users

missing grantees: Mika.Heino@solita.fi

superfluous grantees:

. Checking role ADROLE_DEVELOPER has the appropriate users

missing grantees:

superfluous grantees:

. Checking role ADROLE_SCIENTIST has the appropriate users

missing grantees:

superfluous grantees:

. Checking role ADROLE_ANALYST has the appropriate users

missing grantees: pappa@solita.fi seppo@solita.fi

superfluous grantees:

. Checking role ADROLE_ADMIN has the appropriate roles

missing grantees:

superfluous grantees:

. Checking role ADROLE_DEVELOPER has the appropriate roles

missing grantees:

superfluous grantees:

. Checking role ADROLE_SCIENTIST has the appropriate roles

missing grantees:

superfluous grantees:

. Checking role ADROLE_ANALYST has the appropriate roles

missing grantees:

superfluous grantees:

Without the -WhatIf flag, the script will execute the following SQL Statement:

BEGIN TRANSACTION;

ALTER USER \"teppo@solita.fi\" SET DISABLED=TRUE;

CREATE ROLE \"ADROLE_ADMIN\";

CREATE ROLE \"ADROLE_ANALYST\";

GRANT ROLE \"ADROLE_ADMIN\" TO USER \"mika.heino@solita.fi\";

GRANT ROLE \"ADROLE_ANALYST\" TO USER \"pappa@solita.fi\";

GRANT ROLE \"ADROLE_ANALYST\" TO USER \"seppo@solita.fi\";

REVOKE ROLE \"ADROLE_ANALYST\" FROM USER \"teppo@solita.fi\";

COMMIT;
Final words
I encourage you to test this script a couple of times before leaving it to run by itself. I also want to highlight that all though I’ve been using the script in production for a while, it comes without any support at all and it is a community-developed script, not an official Snowflake offering.
Also I recommend that you leave few Snowflake accounts with ACCOUNTADMIN rights as using AD accounts do not have any password and you might get yourself locked out in situations where SSO -authentication does not work. Keep in my though, that in general practice you should not have large amounts of users with ACCOUNTADMIN -rights as those accounts have highest rights on Snowflake.
Majority of data project limbo around text files. Companies have 10s of different software that they use. Integrating all of the can be sometimes impossible and not so business oriented. That’s why exporting text files from different systems is always easier, than building a datahub.
Self-service solutions make it very easy to import text files and visualise them. This can at one point mean that an individual in an organisation has X amount of excels and csv files that take a lot of space and became a problem. What was the file and is it up to date?
Data in Azure
Storaging, analysing and loading them into Azure is a good option. Azure has several different storage related services available, choosing the right one should always be done case by case. Most convenient one is Azure Data Lake (ADL). ADL is the dream storage place for developer, data scientists and analysts, that need scalable data storage, with easy access to big data. It has all the capabiltities an enterpise needs, security, manageability, scalability, reliability and availability to serve demanding storage requierments. Data projects start with gathering these text files into ADL and then copying them into Azure data warehouse(ADW)/SQL server for reporting. Finding suitable way for doing that can be challenging and time consuming.
Azure provides options like Azure Data Factor(ADF) and PolyBase. Azure Data factor(ADF) is a data processing tool, for managing data pipelines. It is a fully managed ETL service in cloud. ADF can orchestrate data flows from on-premise and cloud sources, which makes it a very flexible and easy to use tool for moving data to and from ADL. It is not just for copying data into databases, you can schedule, manage, analyse, processes and monitor your data pipeline with it. As of most of the systems change, schemas and data models do that as well. ADF works well when nothing isn’t changed in the table side.
On average text files that are > 1 GB that need to be load into ADW/SQL server, would be suggestively done with Polybase. PolyBase is a technology that connects external/internal data with database via t-sql language.
Polybase and ADF loading time are different, for a 5 GB text file it varies from 20 -30 minutes. ADF has a “warming up time”, which means that the system needs some time to be fully available. With PolyBase you can make an insert and it will take around 3-5 minutes for the text file to be in ADW.
Practicalities with PolyBase
Both ADF and Polybase are very sensitive with the data. Key thing to make sure before you start querying data:
Identical schemas and data types
Most errors are symbols inside text rows
Header is not specified
Source file in ADL/Blob has to have permission (Read, Write, Execute)
Reject_value for column names
For making PolyBase data pipeline you need the following: Database scope credentials, External data source, External file Format and External Table. For querying data, I suggest to insert data from external table into regular table.
How it works in practice?
Before you can create Scope credentials you need your client_id and Token_EndPoint, which can be found from azure portal, under Azure Active Directory. After scope credentials have been created, use the same credentials name in the external data source credential phase. Location of the data source, is the place where you have the file.
Creating a file format, define the format based on the text file you are trying to insert. Here is where you can define what type of a text file you have.
CREATE DATABASE SCOPED CREDENTIAL
WITH
IDENTITY = '@',
SECRET = ''
;

CREATE EXTERNAL DATA SOURCE
WITH (
TYPE = HADOOP,
LOCATION = 'adl://.azuredatalakestore.net,
CREDENTIAL =
);

CREATE EXTERNAL FILE FORMAT TextFile
WITH (
FORMAT_TYPE = DelimitedText,
FORMAT_OPTIONS (FIELD_TERMINATOR = '|'
,STRING_DELIMITER = '' ),

);
After that create external table add the location in the Data Lake.
Credentials are connected to the folder inside the Data Lake, so you can’t create the external table before the folder has credentials. According to Microsoft this is the best practice to insert data into ADW.
Summary:
In case where schemas won’t change or have little changes external tables are a good way of managing regular data flows. Automating loads between ADL and ADW, Microsoft suggest SSIS usage. There is also an open source option Airflow, which is a platform to programmatically author, schedule and monitor workflows.