SQL Santa for Factory and Fleet

Awesome SQL Is coming To Town

We have a miniseries before Christmas coming where we talk S-Q-L, /ˈsiːkwəl/ “sequel”. Yes, the 47 years old domain-specific language used in programming and designed for managing data. It’s very nice to see how old faithful SQL is going stronger than ever for stream processing as well the original relational database management purposes.

What is data then and how that should be used ? Take a look on article written in Finnish “Data ei ole öljyä, se on lantaa”

We will show you how to query and manipulate data across different solutions using the same SQL programming language.

The Solita Developer survey has become a tradition here at Solita and please check out the latest survey. It’s easy to see how SQL is dominating in a pool of many cool programming languages. It might take an average learner about two to three weeks to master the basic concepts of SQL and this is exactly what we will do with you.

Data modeling and real-time data

Operative technology (OT) solution have been real time from day one despite it’s also a question of illusion of real-time when it comes to IT systems. We could say that having network latency 5-15 ms towards Cloud and data processing with single-digit millisecond latency irrespective of the scale is considered near real time. This is important for Santa Claus and Industry 4.0 where autonomous fleet, robots and real-time processing in automation and control is a must have. Imagine situation where Santa’s autonomous sleigh with smart safety systems boosted computer vision (CV) able bypass airplanes and make smart decisions would have time of unit seconds or minutes – that would be a nightmare.

A data model is an abstract model that organizes elements of data and standardizes how they relate to one another and to the properties of real-world entities.

It’s easy to identify at least conceptual, logical and physical data models, where from the last one we are interested the most in this exercise to store and query data.

Back to the Future

Dimensional model heavily development by Ralph Kimball was breakthrough 1996 and had concepts like fact tables, dimension and ultimately creating a star schema. Challenge of this modeling is to keep conformed dimensions across the data warehouse and data processing can create unnecessary complexity.

One of the main driving factors behind using Data Vault is for both audit and historical tracking purposes. This methodology was developed by Daniel (Dan) Linstedt in early 2000. It has gain a lot of attraction being able to support especially modern cloud platform with massive parallel processing (MPP) of data loading and not to worry so much of which entity should be loaded first. Possibility even create data warehouse from scratch and just loading data in is pretty powerful when designing an idempotent system. 

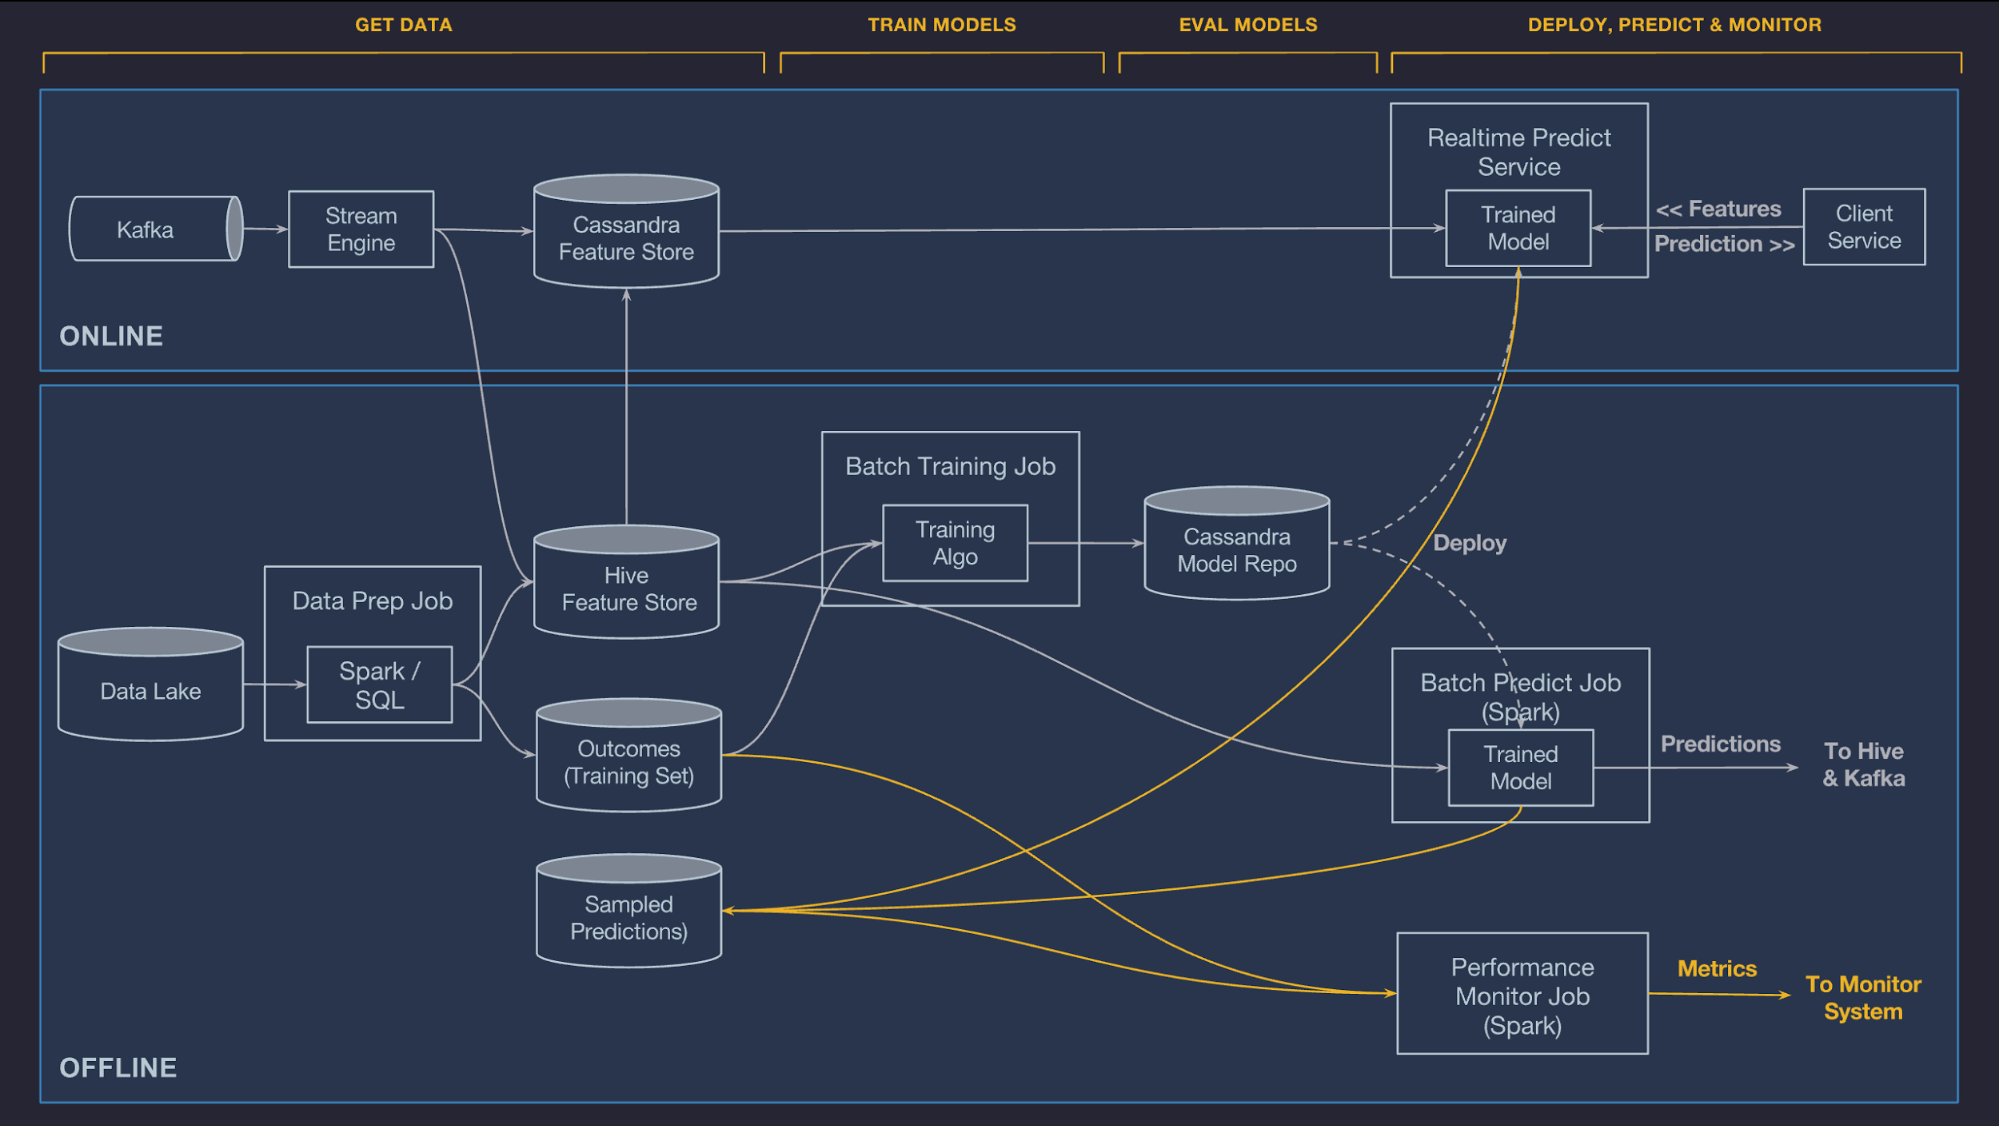
Quite typical data flow looks like picture above and like you already noticed this will have impact on how fast data is landed into applications and users. Theses for Successful Modern Data Warehousing are useful to read when you have time.

Data Mesh ultimate promise is to eliminate the friction to deliver quality data for producers and enable consumers to discover, understand and use the data at rapid speed. You could imagine this as data products in own sandboxes with some common control plane and governance. In any case to be successful you need expertise from different areas such as business, domain and data. End of the day Data Mesh does not take a strong position on data modeling.

Wide Tables / One Big Table (OBT) that is basically nested and denormalized tables is one modeling that is perhaps the mostly controversy. Shuffling data between compute instances when executing joins will have negative impact on performance (yes, you can e.g. replicate dimensional data to nodes and keep fact table distributed which will improve performance) and very often operational data structures produced by micro-services and exchanged over API are closer to this “nested” structure. Having same structure and logic for batch SQL as streaming SQL will ease your work.

Breaking down the OT data items to multiple different sub optimal data strictures inside IT systems will loose the single, atomic data entity. Having said this it’s possible to ingest e.g. Avro files to MPP, keeping the structure same as original file as and using evolving schemas to discovery new attributes. That can be then use as baseline to load target layers such as Data Vault.

One interesting concept called Activity Schema that is sold us as being designed to make data modeling and analysis substantially simpler, faster.

Contextualize data

For our industrial Santa Claus case one very important thing is how to create inventory and contextualize data. One very promising path is an augmented data catalog that will cover a bit later. For some reason there is material out there explaining how IoT data has no structure which is just incorrect. The only reason I can think is that kind of data asset was not fit to traditional data warehouse thinking.

Something to take a look is Apache Avro that is a language-neutral data serialization system, developed by Doug Cutting, the father of Hadoop. The other one is JSON is an open standard file format and data interchange format that uses human-readable text to store and transmit data objects consisting of attribute–value pairs and arrays. This is not solution for data modeling even more you will notice later on this blog post how those are very valuable on steaming data and having schema compared to other formats like CSV.

Business case for Santa

Like always everything starts with Why and solution discovery phase, what we actual want to build and would that have a business value. At Christmas time our business is around gifts and how to deliver those on time. Our model is a bit more simplified and will include operational technology systems such as assets (Santa’s workshop) and fleet (sleighs) operations. There might always be something broken so few maintenance needs are pushed to technicians (elfs). Distributed data platform is used for supply chain and logistics analytics to remove bottlenecks so business owners can be satisfied (Santa Claus and the team) and all gifts will be delivered to the right address just in time.

Case Santa’s workshop

We can later use OEE to calculate that workshop performance in order to produce high quality nice gifts. Data is ingested real time and contextualized so once a while Santa and the team will check how we are doing. In this specific case we know that using Athena we can find relevant production line data just querying the S3 bucket where all raw data is stored already.

Day 1 – creating a Santa’s table for time series data

Let’s create a very basic table to capture all data from Santa’s factory floor. You will notice there are different data types like bigint and string. You can even add comments to help others to later find what kind of data field should include. In this case raw data is Avro but you do not have to worry about that so let’s go.

CREATE EXTERNAL TABLE `raw`(

`seriesid` string COMMENT 'from deserializer',

`timeinseconds` bigint COMMENT 'from deserializer',

`offsetinnanos` bigint COMMENT 'from deserializer',

`quality` string COMMENT 'from deserializer',

`doublevalue` double COMMENT 'from deserializer',

`stringvalue` string COMMENT 'from deserializer',

`integervalue` int COMMENT 'from deserializer',

`booleanvalue` boolean COMMENT 'from deserializer',

`jsonvalue` string COMMENT 'from deserializer',

`recordversion` bigint COMMENT 'from deserializer'

) PARTITIONED BY (

`startyear` string, `startmonth` string,

`startday` string, `seriesbucket` string

)

Day 2 – query Santas’s data

Now we have a table and how to query that one ? That is easy with SELECT and taking all fields using asterix. It’s even possible to limit that to 10 rows which is always a good practice.

SELECT * FROM "sitewise_out"."raw" limit 10;

Day 3 – Creating a view from query

View is a virtual presentation of data that will help to organize assets more efficiently. One golden rule is still now to create many views on top of other views and keep the solution simple. You will notice that CREATE VIEW works nicely and now we have timeinseconds and actual factory floor value (doublevalue) captured. You can even drop the view using DROP command.

CREATE OR REPLACE VIEW "v_santa_data"

AS SELECT timeinseconds, doublevalue FROM "sitewise_out"."raw" limit 10;

Day 4 – Using functions to format dates to Santa

You noticed that timeinseconds is in Epoch so let’s use functions to have more human readable output. So we add a small from_unixtime function and combine that with date_format to have formatted output like we want. Perfect, now we know from which data Santa Claus manufacturing data originated.

SELECT date_format(from_unixtime(timeinseconds),'%Y-%m-%dT%H:%i:%sZ') , doublevalue FROM "sitewise_out"."raw" limit 10;

 Day 5 – CTAS creating a table

Using CTAS (CREATE TABLE AS SELECT) you can even create a new physical table easily. You will notice that Athena specific format has been added that you do not need on relational databases.

CREATE TABLE IF NOT EXISTS new_table_name

WITH (format='Avro') AS

SELECT timeinseconds , doublevalue FROM "sitewise_out"."raw" limit 10;

Day 6 – Limit the result sets

Now I want to limit the results to only those where the quality is Good.Adding a WHERE clause I can have only those rows printed to my output – that is cool!

SELECT * FROM "sitewise_out"."raw"  where quality='GOOD' limit 10;


Case Santa’s fleet

Now we jump into Santa’s fleet meaning sleights and there is few attribute we are interested like SleightD , IsSmartLock, LastGPSTime , SleightStateIDLatitude and Longitude. This data is time series that is ingested into our platform near real-time. Let’s use AWS Timestream service which is fast, scalable, and serverless time series database service for IoT and operational applications. A time series is a data set that tracks a sample over time. 

Day 7 – creating a table for fleet

You will notice very quickly that data model looks different than on relational database cases. There is no need beforehand to define table structure just executing CreateTable is enough.


Day 8- query the latest record

You can override time field using e.g. LastGPSTime, in this example we use time when data was ingested in, so getting the last movement of sleigh would be like this.

SELECT * FROM movementdb.tbl_movement
ORDER BY time DESC
LIMIT 1

Day 9- let’s check the last 24 hours movement

We can use time to filter our results and ordering on descending same time.

SELECT *
FROM "movementdb"."tbl_movement" 
WHERE time > ago(24h) 
ORDER BY time DESC

Day 10- latitude and longitude

We can find out latitude and longitude information easily and please note we are using IN operator to bet both to query result.

SELECT measure_name,measure_value::double,time 
FROM "movementdb"."tbl_movement" 
WHERE time > ago(24h) 
and measure_name in ('Longitude','Latitude')
ORDER BY time DESC LIMIT 10

Day 11- last connectivity info

Now we use 2 things so we group data based on sleigh id and find the maximum value. This will tell when sleigh was connected and sending data to our platform. There are plenty of functions to choose from so please check documentation.

SELECT greatest (time) as last_time, sleighId
FROM "movementdb"."tbl_movement" 
WHERE time > ago(24h) 
and measure_name = ('LastGPSTime')
group by sleighId,greatest (time)

Day 12- using conditions for smart lock data

CASE is very powerful to manipulate the query results so in this example we use that do indicate better if sleigh had smart lock.

SELECT time, measure_name,
CASE 
WHEN measure_value::boolean = true THEN 'Yes we have a smart lock'
ELSE 'No we do not that kind of fancy locks'
END AS smart_lock_info
FROM "movementdb"."tbl_movement"
WHERE time between ago(1d) and now() 
and measure_name='IsSmartLock'

Day 13- finding the latest battery level on each fleet equipment

This would be a bit more complex so we have one query to find max value of battery level and then we later join that to base data so on each record we know the latest battery level in the past 24 hours. Please notice we are using INNER join in this example.

WITH latest_battery_time as (
select 
d_sleighIdentifier, 
max(time) as latest_time 
FROM 
"movementdb"."tbl_movement" 
WHERE 
time between ago(1d) 
and now() 
and measure_name = 'Battery' 
group by 
d_sleighIdentifier
) 
SELECT 
b.d_sleighIdentifier, 
b.measure_value :: double as last_battery_level 
FROM 
latest_battery_time a 
inner join "movementdb"."tbl_movement" b on a.d_sleighIdentifier = b.d_sleighIdentifier 
and b.time = a.latest_time 
WHERE 
b.time between ago(1d) 
and now() 
and b.measure_name = 'Battery'

Day 14- distinct values

The SELECT DISTINCT statement is used to return only distinct (different) values. This is so create and also very misused when removing duplicates etc. when actual problem can be on JOIN conditions.

SELECT 
DISTINCT (d_sleighIdentifier) 
FROM 
"movementdb"."tbl_movement"

Day 15- partition by is almost magic

The PARTITION BY clause is a subclause of the OVER clause. The PARTITION BY clause divides a query’s result set into partitions. The window function is operated on each partition separately and recalculate for each partition. This is almost a magic and that can be used in several ways like in this example identify last sleigh Id.

select 
d_sleighIdentifier, 
SUM(1) as total, 
from 
(
SELECT 
*, 
first_value(d_sleighIdentifier) over (
partition by d_sleighTypeName 
order by 
time desc
) lastaction 
FROM 
"movementdb"."tbl_movement" 
WHERE 
time between ago(1d) 
and now()
) 
GROUP BY 
d_sleighIdentifier, 
lastaction

Day 16- interpolation (values of missing data points)

Timestream and few other IoT services supports linear interpolation, enabling to estimate and retrieve the values of missing data points in their time series data. This will come very handy when our fleet is not connected all the time, in this example we used it for our smart sleight battery level.

WITH rawseries as (
select 
measure_value :: bigint as value, 
time as d_time 
from 
"movementdb"."tbl_movement" 
where 
measure_name = 'Battery'
), 
interpolate as (
SELECT 
INTERPOLATE_LINEAR(
CREATE_TIME_SERIES(d_time, value), 
SEQUENCE(
min(d_time), 
max(d_time), 
1s
)
) AS linear_ts 
FROM 
rawseries
) 
SELECT 
time, 
value 
FROM 
interpolate CROSS 
JOIN UNNEST(linear_ts)

Case Santa’s  master data

Now we jump into Master Data when factory and fleet is up are covered. In this very complex supply chain system customer data is very typical transactional data and in this exercise we keep it very atomic having stored only very basic info into DynamoDB that is a fully managed, serverless, key-value NoSQL database designed to run high-performance applications at any scale. We use this data to on IoT data streams for join, filtering and other purposes in fast manner. Good to remember that DynamoDB is not build for complex query patterns so it’s best on it’s original key=value data query pattern.

Day 17- adding master data

We upload our customer data into DynamoDB so called “items” based om the list received from Santa.

{
"customer_id": {
"S": "AJUUUUIIIOS"
},
"category_list": {
"L": [
{
"S": "Local Businesses"
},
{
"S": "Restaurants"
}
]
},
"homepage_url": {
"S": "it would be here"
},
"founded_year": {
"N": "2021"
},
"contract": {
"S": "NOPE"
},
"country_code": {
"S": "FI"
},
"name": {
"S": ""
},
"market_stringset": {
"SS": [
"Health",
"Wellness"
]
}
}

Day 18- query one customer item

Amazon DynamoDB supports PartiQL, a SQL-compatible query language, to select, insert, update, and delete data in Amazon DynamoDB. That is something we will use too speed up things. Let’s first query one customer data asset.

SELECT * FROM "tbl_customer" where customer_id='AJUUUUIIIOS'

Day 18- update kids information

Using the same PartiQL you can update item to have new attributes with one go.

UPDATE "tbl_customer" 
SET kids='2 kids and one dog' 
where customer_id='AJUUUUIIIOS'

Day 19- contains function

Now we can easily check that form marketing data who was interested on Health using CONTAINS. Many moderns database engines have native support for semi-structured data, including: Flexible-schema data types for loading semi-structured data without transformation. If you are not already familiar please take a look on AWS Redshift and Snowflake.

SELECT * FROM "tbl_customer" where contains("market_stringset", 'Health')

Day 20- inserting a new customer

Using familiar SQL like it’s very straightforward to add one new item.

INSERT INTO "tbl_customer" value {'name' : 'name here','customer_id' : 'A784738H'}

Day 21- missing data

Using a special MISSING you can find those where some attribute is not present easily.

SELECT * FROM "tbl_customer" WHERE "kids" is MISSING

Day 22- export data into s3

With one command you can export data from DynamoDB to S3 so let’s do that one based on documentation. AWS and others do have support for something called Federated Query where you can run SQL queries across data stored in relational, non-relational, object, and custom data sources. This federated feature we will cover later with You.

Day 23- using S3 select feature

Now you have data stored to  S3 bucket and there is holder called /data so you can even use SQL to query S3 stored data. This will find relevant information for customer_id.

Select s.Item.customer_id from S3Object s

Day 24- s3 select to find right customer

You can even use customer Id to restrict data returned to you.

Select s.Item.customer_id from S3Object s where s.Item.customer_id.S ='AJUUUUIIIOS'


That’s all, I hope you get some glimpse how useful SQL is even you have different services and you might first think this will never be possible to use same kind of language of choice. Please do remember when some day You might be building next generation artificial intelligence and analysis platform with us knowing few data modeling techniques and SQL is a very good start.

You might be interested Industrial equipment data at scale for factory floor or manage your fleet at scale so let’s keep fresh mind and have a very nice week !

 

vision

The Industrial Revolution 6.0

Strength of will, determination, perseverance, and acting rationally in the face of adversity

The Industrial Revolution

The European Commission has taken a very active role to define Industry 5.0 and it complements Industry 4.0 for transformation of sustainable, human-centric and resilient European industry.

Industry 5.0 provides a vision of industry that aims beyond efficiency and productivity as the sole goals, and reinforces the role and the contribution of industry to society. https://ec.europa.eu/info/research-and-innovation/research-area/industrial-research-and-innovation/industry-50_en

Finnish industry is affected by the pandemic, the fragmentation global supply chains and dependency of suppliers all around the world. Finnish have something called “sisu”. It’s a Finnish term that can be roughly translated into English as strength of will, determination, perseverance, and acting rationally in the face of adversity. That might be one reason why in Finland group of people are already defining Industry 6.0 and also one of the reasons we wanted to share our ideas using blog posts such as:

  1. Smart and Connected Factories
  2. Factory Floor and Edge computing
  3. Industrial data contextualization at scale
  4. AWS SageMaker Pipelines – Making MLOps easier for the Data Scientist
  5. Productivity and industrial user experience
  6. Cloud data transformation
  7. Illusion of real-time
  8. Manufacturing security hardening

It’s not well defined where the boundaries on each industrial revolution really are. We can argue that first Industry 1.0 was around 1760 when transition to new manufacturing processes using water and steam was happening.  Roughly 1840 the second industrial revolution was referred to as “The Technological Revolution” where one component was superior electrical technology which allowed for even greater production. Industry 3.0 introduced more automated systems onto the assembly line to perform human tasks, i.e. using Programmable Logic Controllers (PLC).

Present 

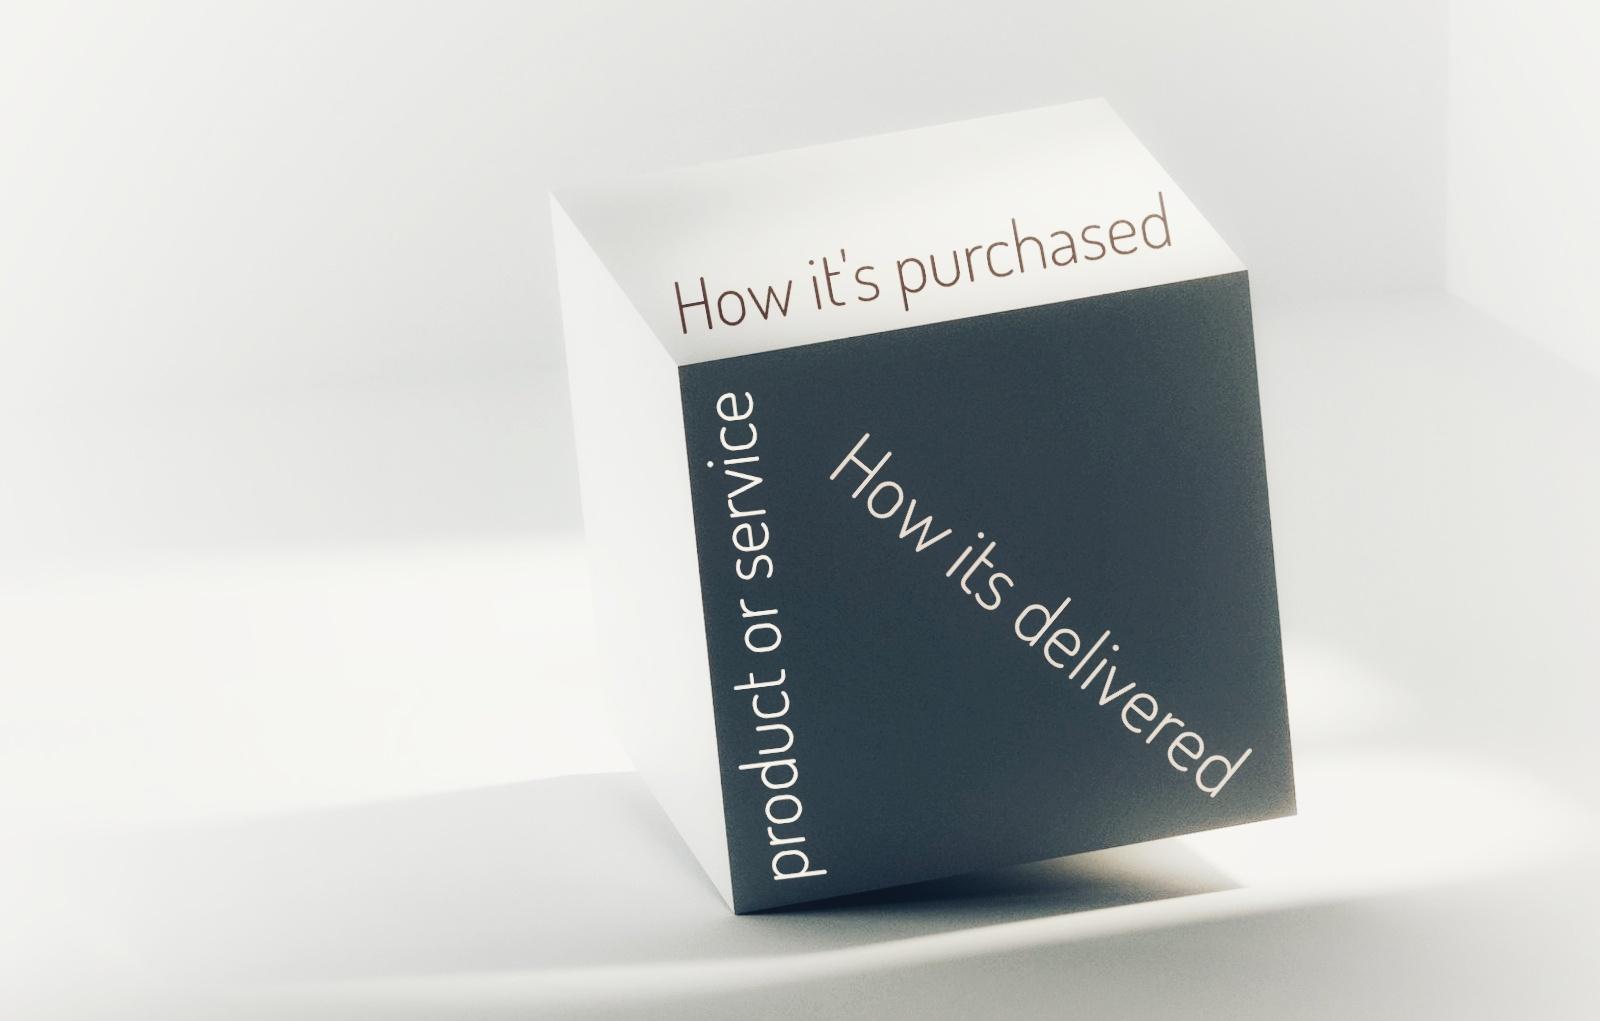
The Fourth Industrial Revolution (Industry 4.0) will incorporate storage systems and production facilities that can autonomously exchange information. How to deliverer and purchase any service or product will have on these 3 dimensions two categories: physical and digital.

IoT has a bit of inflation as a word and the few biggest hype cycles are past life- which is a good thing. The Internet of things (IoT) plays very important role to enable smart connected devices and extend the possibility to Cloud computing. Companies are already creating cyber-physical systems where machine learning (ML) is built into product-centered thinking. Few of the companies have a digital twin that serves as the real-time digital counterpart of a physical object or process.

In Finland with a long history of factory, process and manufacturing companies this is reality and bigger companies are targeting for faster time to market, quality and efficiency. Rigid SAP processes combined with yearly budgets are not blocking future looking products and services – we are past that time. There are great initiatives for sensor networks and edge computing for environment analysis. Software enabled intelligent products, new better offerings based on real usage and how to differentiate on market is everyday business to many of us in the industrial domain.

Future

“When something is important enough, you do it even if the odds are not in your favor.” Elon Musk

World events have pushed industry to rethink how to build and grow business in a sustainable manner. Industry 5.0 is being said to be the revolution in which man and machine reconcile and find ways to work together to improve the means and efficiency of production.  Being on stage or watching your fellow colleagues you can hear words like human-machine co-creative resilience, mass-customization,  sustainability and circular economy. Product complexity is increasing at the same time with ever-increasing customer expectations.

Industry 6.0 exists only in whitepapers but that does not mean that “customer driven virtualized antifragile manufacturing” could be real some day. Hyperconnected factories and dynamic supply chains would most probably benefit all of us. Some are referring to industrial change same way as hyperscalers such as AWS are doing for selling cloud capacity. There are challenges for sure like “Lot Size One” to be economically feasible. One thing is for sure that all models and things will merge, blur and convergence.


Building the builders

“My biggest mistake is probably weighing too much on someone’s talent and not someone’s personality. I think it matters whether someone has a good heart.” – Elon Musk

One fact is that industrial life is not super interesting for millennials. It looks old fashioned so to have a future professional is a must have. Factory floor might not be as interesting as it was a few decades ago. Technology possibilities and cloud computing will boost to have more different people to have interest towards industrial solutions. A lot of ecosystems exist with little collaboration and we think it’s time to change that by reinventing business models, solutions and onboarding more fresh minded people for industrial solutions.

That is one reason we have packaged kickstarts to our customers and anyone interested can grow with us.


Manufacturing security hardening

Securing IT/OT integration


Last time my colleague Ripa and I discussed about industrial UX and productivity. This time I focus on factory security especially in situations when factories will be connected to the cloud.

Historical habits 

As we know for a long time manufacturing OT workloads were separated from IT workloads. Digitalization, IoT and edge computing enabled IT/OT convergence and made it possible to take advantage of cloud services.

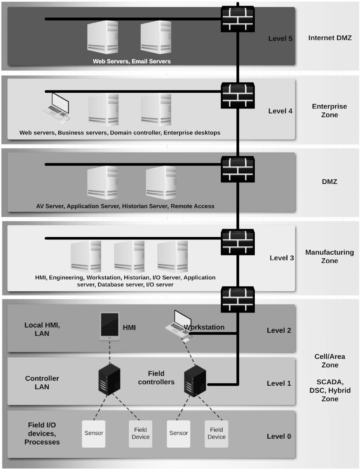
Security model at manufacturing factories has been based on isolation where the OT workload could be isolated and even fully air-gapped from the company’s other private clouds. I recommend you to take a look at the Purdue model back from the 1990s, which was and still is the basis for many factories for giving guidance for industrial communications and integration points. It was so popular and accepted that it became the basis for the ISA-95 standard (the triangle I drew in a blog post). 

Now with new possibilities with the adoption of cloud, IoT, digitalization and enhanced security we need to think: 

Is the Purdue model still valid and is it just slowing down moving towards smart and connected factories?

Purdue model presentation aligned to industrial control system


Especially now that edge computing (manufacturing cloud) is becoming more sensible, we can process the data already at level 1 and send the data to the cloud using existing secured network topology. 

Is the Purdue model slow down new thinking ? Should we have Industrial Edge computing platform that can connect to all layers?


Well architected

Thinking about the technology stack from factory floor up to AWS cloud data warehouses or visualizations, it is huge! It’s not so straightforward to take into account all the possible security principles to all levels of your stack. It might even be that the whole stack is developed during the last 20 years, so there will be legacy systems and technology dept, which will slow down applying modern security principles. 

In the following I summarize 4 main security principles you can use in hybrid manufacturing environments:

  • Is data secured in transit and at rest ? 

Use encryption and if possible enforce it. Use key and certificate management with scheduled rotation. Enforce access control to data, including backups and versions as well. For hardware, use Trusted Platform Module (TPM) to store keys and certificates.

  • Are all the communications secured ? 

Use TLS or IPsec to authenticate all network communication. Implement network segmentation to make networks smaller and tighten trust boundaries. Use industrial protocols like OPC-UA.

  • Is security taken in use in all layers ? 

Go through all layers of your stack and verify that you cover all layers with proper security control.

  • Do we have traceability ? 

Collect log and metric data from hardware and software, network, access requests and implement monitoring, alerting, and auditing for actions and changes to the environment in real time.


Secured data flow 

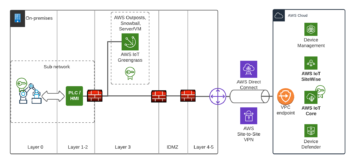
Following picture is a very simplified version of the Purdue model aligned to manufacturing control hierarchy and adopting AWS cloud services. It focuses on how manufacturing machinery data can connect to the cloud securely. Most important thing to note from the picture is that network traffic from on-prem to cloud is private and encrypted. There is no reason to route this traffic through the public internet. 

Purdue model aligned to manufacturing control hierarchy adopting AWS cloud


You can establish a secure connection between the factory and AWS cloud by using AWS Direct Connect or AWS Site-to-Site VPN. In addition to this I recommend using VPC endpoints so you can connect to AWS services without a public IP address. Many AWS services support VPC endpoints, including AWS Sitewise and IoT Core.

Manufacturing machinery is on layers 0-2. Depending on the equipment trust levels it’s a good principle to divide the whole machinery into cells / sub networks to tighten trust boundaries. Machinery with different trust levels can be categorized in its own cells. Using industrial protocols, like OPC-UA, brings authentication and encryption capabilities near the machinery. I’m very excited about the possibility to do server initiated connections (reverse connect) on OPC-UA, which makes it possible for clients to communicate with server without firewall inbound port opening.

As you can see from the picture, data is routed through all layers of and looks like layers IDMZ (Industrial Demilitarized Zone), 4 and 5 are almost empty. As discussed earlier, only for connecting machinery to the cloud via secure tunneling we could bypass some layers. But for other use cases the layers are still needed. If for some reason we need to route factory network traffic to AWS Cloud through the public internet, we need a TLS proxy on IDMZ to encrypt the traffic and protect the factory from DDoS attacks (Distributed Denial of Service attack).

The edge computing unit on Layer 3 is a AWS Greengrass device which ingests data from factory machinery, processes the data with ML and sends only the necessary data to the cloud. The unit can also discuss and ingest data from Supervisory Control and Data Acquisition (SCADA), and Distributed Control System (DCS) and other systems from manufacturing factories. AWS Greengrass uses x509 certificate based authentication to AWS cloud. Idea is that the private key will not leave from the device and is protected and stored in the device’s TPM module. All the certificates are stored to AWS IoT Core and can be integrated to custom PKI. For storing your custom CA’s (Certificate Authority) you can use AWS ACM. I strongly recommend to design and build certificate lifecycle policies and enforce certificate rotation for reaching a good security level.

One great way of auditing your cloud IoT security configuration is to audit it with AWS IoT Device Defender. Also you can analyse the factory traffic real-time, find anomalies and trigger security incidents automatically when needed.


Stay tuned

Security is our best friend, you don’t need to be afraid of it.

Build it to all layers, from bottom to top in as early a phase as possible. AWS has the security capabilities to connect private networks to the cloud and do edge computing and data ingesting in a secure way. 

Stay tuned for next posts and check out our Connected Factory Kickstart if you haven’t yet

https://www.solita.fi/en/solita-connected/


Illusion of real-time

Magic is the only honest profession. A magician promises to deceive you and he does.

Cloud data transformation

Tipi shared thoughts on how data assets could be utilized on Cloud. We had few question after blog post and one of those was “how to tackle real time requirements ?

Let’s go real time ?

Real-time business intelligence is a concept describing the process of delivering business intelligence or information about business operations as they occur. Real time means near to zero latency and access to information whenever it is required.

We all remember those nightly batch loads and preprocessing data –  waiting a few hours before data is ready for reports. Someone is looking if sales numbers are dropped and the manager will ask quality reports from production. Report is evidence to some other team what is happening in our business.

Let’s go back to the definition that says “information whenever it is required” so actually for some of the team(s) even one week or day can be realtime. Business processes and humans are not software robots so taking action based on any data will take more than a few milliseconds so where is this real time requirement coming from ?

Marko had a nice article related to OT systems and Factory Floor and Edge computing. Any factory issue can be a major pain and downtime is not an option and explained how most of the data assets like metrics and logs must be available immediately in order to recover and understand the root cause.

Hyperscalers and real time computing

In March 2005, Google acquired the web statistics analysis program Urchin, later known as Google Analytics. That was one of the customer facing solutions to gather massive amount of data. Industrial protocols like Modbus from 1970 was designed to work real time on that time and era. Generally speaking real time computing has three categories:

  • Hard – missing a deadline is a total system failure.
  • Firm – infrequent deadline misses are tolerable, but may degrade the system’s quality of service. The usefulness of a result is zero after its deadline.
  • Soft – the usefulness of a result degrades after its deadline, thereby degrading the system’s quality of service.

So it’s easy to understand that airplane turbine and rolling 12 months sales forecast have different requirements. .

What is the cost of (data) delay ?

“A small boat that sails the river is better than a large ship that sinks in the sea.”― Matshona Dhliwayo

We can simply estimate the value a specific feature would bring in after its launch and multiply this value with the time it will take to build. That will tell the economic impact that postponing a task will have.

High performing teams can do cost of delay estimation to understand which task should take first.  Can we calculate and understand the cost of delayed data? How much that will cost to your organization if service or product must be postponed because you are missing data or you can not use it.

Start defining real-time

You can easily start discussing what kind of data is needed to improve customer experience.  Real time requirements might be different for each use case and that is totally fine. It’s a good practice to specify near real time requirements in factual numbers and few examples. It’s good to remember that end to end can have totally different meanings. Working with OT systems for example the term First Mile is used when protect and connect OT systems with IT.

Any equipment failure must be visible to technicians at site in less than 60 seconds. ― Customer requirement

Understand team topologies

Incorrect team topology can block any near real time use cases. That means that adding each component and team deliverable to work together might end up having unexpected data delays. Or in the worst case scenario a team is built too much around one product / feature that will have come a bottleneck later when building more new services.

Data as a product refers to an idea where the job of the data team is to provide the data that the company needs. Data as a Service team partners with stakeholders and have more functional experience and are responsible for providing insight as opposed to rows and columns. Data Mesh is about the logical and physical interconnections of the data from producers through to consumers.

Team topologies will have a huge impact on how data driven services are built and can data land to business case purposes just on the right time.

Enable Edge streaming and APIs capabilities

On cloud services like AWS Kinesis is great, it is a scalable and durable real-time data streaming service that can continuously capture gigabytes of data per second. Apache Kafka is a framework implementation of a software bus using stream-processing. Apache Spark is an open-source unified analytics engine for large-scale data processing.

I am sure that at least one of these you are already familiar with. In order to control data flow we have two parameters: amount of messages and time. Which will come first will se served.

 Is your data solution idempotent and able to handle data delays ? ― Customer requirement

Modern purpose-built databases have capability to process streaming data. Any extra layer of data modeling will add a delay for data consumption. On Edge we typically run purpose-built robust database services in order to capture all factory floor events with industry standard data models.

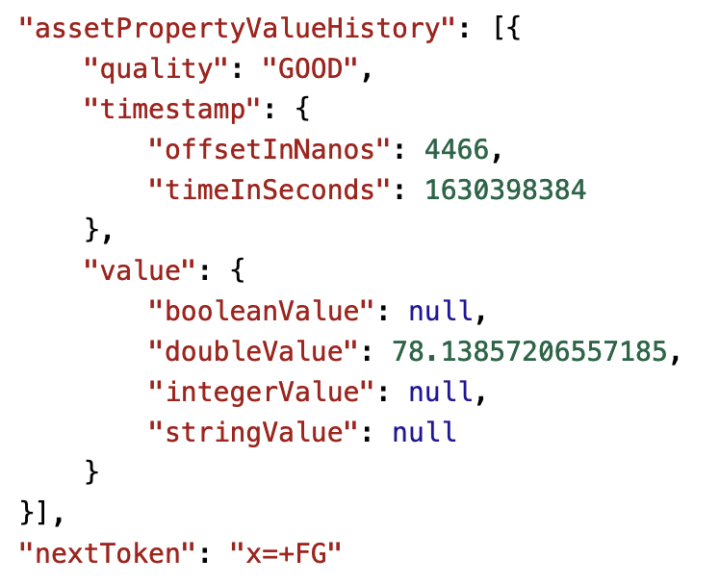
Site and Cloud API is a contact between different parties and will improve connectivity and collaboration. API calls on Edge works nicely and you can have data available in less than 70-300ms from Cloud endpoint (example below). Same data is available on Edge endpoint where client response is even faster so building factory floor applications is easy.

curl --location --request GET 'https://data.iotsitewise.eu-west-1.amazonaws.com/properties/history?assetId=aa&maxResults=1&propertyId=pp --header 'X-Amz-Date: 20211118T152104Z' --header 'Authorization: AWS4-HMAC-SHA256 Credential=xxx, SignedHeaders=host;x-amz-date, Signature=xxxx

Quite many databases has built-in Data API. It’s still good to remember that underlying engine, data model and many factors will determine how scalable solution really is.

AWS GreenGrass StreamManager is a component that enables you to process data streams to transfer to the AWS Cloud from Greengrass core devices. Other services like Firehose is supported using specific aws.greengrass.KinesisFirehose component. These components will support also building Machine Learning (ML) features on Edge as well.


Conclusion

Business case will define the requirement of real time. Build your near real time capabilities according to your future proof architecture – adding real time capabilities later might come almost impossible. 

If business case is not clear enough what should I do ? Maybe a cup of tea, relax and read blog post from Johannes The gap between design thinking and business impact

You might be interested our kickstarts Accelerate cloud data transformation ​and Industrial equipment data at scale

Let’s stay fresh-minded !


Accelerate cloud data transformation

Cloud data transformation

Data silos and unpredicted costs preventing innovation

Cloud database race ?

One of the first cloud services was S3 launched in 2006.  AWS Hadoop based Amazon SimpleDB  was released in 2007 and after that there have been many nice cloud database products from multiple cloud hyperscalers. Database as a service (DBaaS) has been a prominent service when customers are looking for scaling, simplicity and taking advantage of the ecosystem. It has been estimated that the Cloud database and DBaaS market was estimated to be USD 12,540 Million by 2020, so no wonder there is a lot of activity. Looking from a customer point of view this is excellent news when the cloud database service race is on and new features are popping up and same time usage costs are getting lower. I can not remember the time when creating a global solution backed by a database would be so cost efficient as it is now.


Why should I move data assets to the Cloud ?

There are few obvious reasons like rapid setup, cost efficiency, scaling solutions and integration to other Cloud services. That will give nice security enforcement in many cases where old school username and password is not used like in some on premises systems still do.


“No need to maintain private data centers”, “No need to guess capacity”


Cloud computing instead typical on premises setup is distributed by nature, so computing and storage are separated. Data replication to other regions is supported out of the box in many solutions, so data can be stored as close as possible to end users for best in class user experience.

In the last few years even more database service can work seamlessly with on premises and cloud. Almost all data related cases have aspects of machine learning nowadays and Cloud empowers teams to enable machine learning in several different ways: in built into database services, purpose-built services or using native integrations. Just using the same development environment and using industry standard SQL you can do all ML phases easily. Database integrated AutoML aims to empower developers to create sophisticated ML models without having to deal with all the phases of ML – that is a great opportunity for any Citizen data scientist !


Purpose build databases to support diverse data models

Beauty of cloud comes rapidly with flexibility and pay as you go model with very real time cost monitoring. You can cherry pick the best purpose-built database (relational, key-value, document, in-memory, graph, time series, wide column, and ledger databases.) to suit your use case, data models and avoid building one big monolithic solution.

Snowflake is one of the few enterprise-ready cloud data warehouses that brings simplicity without sacrificing features and can be operated on any major cloud platform. Amazon Relational Database Service (Amazon RDS) makes it easy to set up, operate, and scale to any relational database in the cloud. Amazon Timestream is a nice option for serverless, super fast time series processing and near real time solutions. You might have a Hadoop system or running a non-scalable relational database on premises and think about how to get started on a journey for improved customer experience and digital services?

Success for your cloud data migration

We have worked with our customers to build a Data Migration strategy. That will help in understanding the migration options, create a plan and also validate future proof architecture.

Today we share with you here a few tips that might help you when planning data migrations.

  1. Employee experience – embrace your team, new possibilities and replace pure technical approach to include commitment from your team developers. Domain knowledge of data assets and applications is very important and building a trust to new solutions from day one.
  2. Challenge your partner of choice. There is more than lift and shift or creating all from scratch options. It might be that all data assets are not needed or useful anymore. Our team is working on a vertical slicing approach where the elephant is splitted to manageable pieces. Using state of the art accelerator solutions we can make an inventory using real life metrics. Let’s make sure that you can avoid the big bang and current systems can operate without impact even when building new systems.
  3. Bad design and technical debt of legacy systems. It’s very typical that old systems’ performance and design can be broken already.  That is something which is not visible to all stakeholders and when doing the first Cloud transformation all that will come visible will pop up. Prepare yourself for surprises – take that as an opportunity to build more robust architecture. Do not try to fix all problems at once !
  4. Automation to the bones. In order to be able to try and replay data make sure everything is fully automated including database, data loading and integrations. So, making a change is fun and not something to be careful of. It’s very hard to build DataOps to on premises systems because of the nature of operating models, contracts and hardware limitations. In Cloud those are not the blockers anymore.
  5. Define workloads and scope ( no low hanging fruits only) . Taking one database and moving that to the Cloud can not be used as any baseline when you have hundreds of databases. Metrics from the first one should not be used as a matrix multiplied by the amount of databases when thinking about the whole project scope. Take a variety of different workloads and solutions, some even the hard one to first sprint. It’s better to start immediately and not wait for any target systems because on Cloud that is totally redundant.
  6. Welcome Ops model improvement. On Cloud database metrics of performance (and any other kind) and audit trails are all visible so creating a more proactive and risk free ops model is at your fingertips. My advice is not to copy the existing Ops model with the current SLA as it is. High availability and recovery are different things – so do not mix those.
  7. Going for meta driven DW. In some cases choosing state of the art automated warehouse like Solita Agile Data Engine (ADE) will boost your business goals when you are ready to take a next step.


Let’s kick the Cloud Data transformation ongoing !

Take advantage of cloud when building digital services with less money and faster with our Accelerate cloud data transformation kickstart

You might be interested also Migrating to the cloud isn’t difficult, but how to do it right?

Productivity and industrial user experience

Digital employee is not software robot


The last post was about data contextualisation and today on this video blog post we talk about the Importance of User Experience in an Industrial Environment.

UX versus employee experience

User Experience (UX) design is the process design teams use to create products that provide meaningful and relevant experiences to users. 

Employee experience is a worker’s perceptions about his or her journey through all the touchpoints at a particular company, starting with job candidacy through to the exit from the company. 

Using modern, digital tools and platforms can support employee experience and create competitive advantage. Especially working on factory systems and remote locations it’s important to keep good productivity and one option is cloud based manufacturing.

Stay tuned for more and check our Connected Factory kickstart:

https://www.solita.fi/en/solita-connected/

AWS SageMaker Pipelines – Making MLOps easier for the Data Scientist

SageMaker Pipelines is a machine learning pipeline creation SDK designed to make deploying machine learning models to production fast and easy. I recently got to use the service in an edge ML project and here are my thoughts about its pros and cons. (For more about the said project refer to Solita data blog series about IIoT and connected factories https://data.solita.fi/factory-floor-and-edge-computing/)

Example pipeline

Why do we need MLOps?

First, there were statistics then came the emperor’s new clothes – machine learning, a rebranding of old methods accompanied with new ones emerged. Fast forward to today and we’re all the time talking about this thing called “AI”, the hype is real, it’s palpable because of products like Siri and Amazon Alexa.

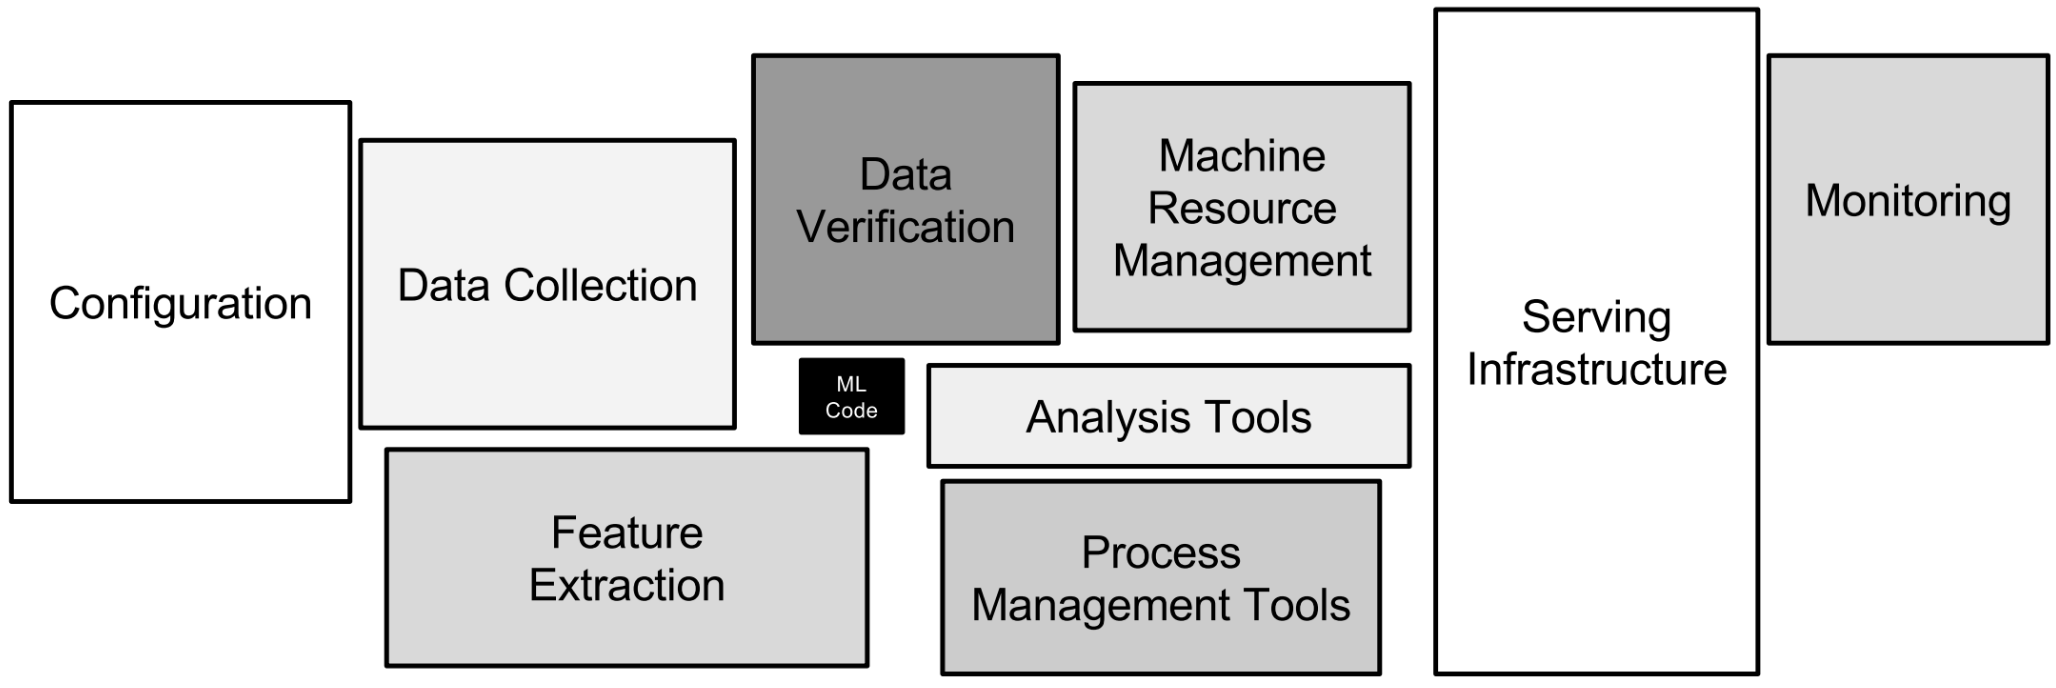
But from a Data Scientist point of view, what does it take to develop such a model? Or even a simpler model, say a binary classifier? The amount of work is quite large, and this is only the tip of the iceberg. How much more work is needed to put that model into the continuous development and delivery cycle?

For a Data Scientist, it can be hard to visualize what kind of systems you need to automate everything your model needs to perform its task. Data ETL, feature engineering, model training, inference, hyperparameter optimization, performance monitoring etc. Sounds like a lot to automate?

(Hidden technical debt in machine learning https://proceedings.neurips.cc/paper/2015/file/86df7dcfd896fcaf2674f757a2463eba-Paper.pdf)


This is where MLOps comes to the picture, bridging DevOps CI/CD practices to the data science world and bringing in some new aspects as well. You can see more information about MLOps from previous Solita content such as https://www.solita.fi/en/events/webinar-what-is-mlops-and-how-to-benefit-from-it/ 

Building an MLOps infrastructure is one thing but learning to use it fluently is also a task of its own. For a Data Scientist at the beginning of his/her career, it could seem too much to learn how to use cloud infrastructure as well as learn how to develop Python code that is “production” ready. A Jupyter notebook outputting predictions to a CSV file simply isn’t enough at this stage of the machine learning revolution.

(The “first” standard on MLOps, Uber Michelangelo Platform https://eng.uber.com/michelangelo-machine-learning-platform/)


A Jupyter notebook outputting predictions to a CSV file simply isn’t enough at this stage of the machine learning revolution.

Usually, companies that have a long track record of Data Science projects have a few DevOps, Data Engineer/Machine Learning Engineer roles working closely with their Data Scientists teams to distribute the different tasks of production machine learning deployment. Maybe they even have built the tooling and the infrastructure needed to deploy models into production more easily. But there are still quite a few Data Science teams and data-driven companies figuring out how to do this MLOps thing.

Why should you try SageMaker Pipelines?

AWS is the biggest cloud provider ATM so it has all the tooling imaginable that you’d need to build a system like this. They are also heavily invested in Data Science with their SageMaker product and new features are popping up constantly. The problem so far has been that there are perhaps too many different ways of building a system like this.

AWS tries to tackle some of the problems with the technical debt involving production machine learning with their SageMaker Pipelines product. I’ve recently been involved in project building and deploying an MLOps pipeline for edge devices using SageMaker Pipelines and I’ll try to provide some insight on why it is good and what is lacking compared to a completely custom-built MLOps pipeline.

The SageMaker Pipelines approach is an ambitious one. What if, Data Scientists, instead of having to learn to use this complex cloud infrastructure, you could deploy to production just by learning how to use a single Python SDK (https://github.com/aws/sagemaker-python-sdk)? You don’t even need the AWS cloud to get started, it also runs locally (to a point).

SageMaker Pipelines aims at making MLOps easy for Data Scientists. You can define your whole MLOps pipeline in f.ex. A Jupyter Notebook and automate the whole process. There are a lot of prebuilt containers for data engineering, model training and model monitoring that have been custom-built for AWS. If these are not enough you can use your containers enabling you to do anything that is not supported out of the box. There are also a couple of very niche features like out-of-network training where your model will be trained in an instance that has no access to the internet mitigating the risk of somebody from the outside trying to influence your model training with f.ex. Altered training data.

You can version your models via the model registry. If you have multiple different use cases for the same model architectures with differences being in the datasets used for training it’s easy to select the suitable version from SageMaker UI or the python SDK and refactor the pipeline to suit your needs.  With this approach, the aim is that each MLOps pipeline has a lot of components that are reusable in the next project. This enables faster development cycles and the time to production is reduced. 

SageMaker Pipelines logs every step of the workflow from training instance sizes to model hyperparameters automatically. You can seamlessly deploy your model to the SageMaker Endpoint (a separate service) and after deployment, you can also automatically monitor your model for concept drifts in the data or f.ex. latencies in your API. You can even deploy multiple versions of your models and do A/B testing to select which one is proving to be the best.

And if you want to deploy your model to the edge, be it a fleet of RaspberryPi4s or something else, SageMaker provides tooling for that also and it seamlessly integrates with Pipelines.

You can recompile your models for a specific device type using SageMaker Neo Compilation jobs (basically if you’re deploying to an ARM etc. device you need to do certain conversions for everything to work as it should) and deploy to your fleet using SageMaker fleet management.

Considerations before choosing SageMaker Pipelines

By combining all of these features to a single service usable through SDK and UI, Amazon has managed to automate a lot of the CI/CD work needed for deploying machine learning models into production at scale with agile project development methodologies. You can also leverage all of the other SageMaker products f.ex. Feature Store or Forekaster if you happen to need them. If you’re already invested in using AWS you should give this a try.

Be it a great product to get started with machine learning pipelines it isn’t without its flaws. It is quite capable for batch learning settings but there is no support as of yet for streaming/online learning tasks. 

And for the so-called Citizen Data Scientist, this is not the right product since you need to be somewhat fluent in Python. Citizen Data Scientists are better off with BI products like Tableau or Qlik (which use SageMaker Autopilot as their backend for ML) or perhaps with products like DataRobot. 

And in a time where software products are high availability and high usage the SageMaker EndPoints model API deployment scenario where you have to pre-decide the number of machines serving your model isn’t quite enough.

 In e-commerce applications, you could run into situations where your API is receiving so much traffic that it can’t handle all the requests because you didn’t select a big enough cluster to serve the model with. The only way to increase the cluster size in SageMaker Pipelines is to redeploy a new revision within a bigger cluster. It is pretty much a no brainer to use a Kubernetes cluster with horizontal scaling if you want to be able to serve your model as the traffic to the API keeps increasing.

Overall it is a very nicely packaged product with a lot of good features. The problem with MLOps in AWS has been that there are too many ways of doing the same thing and SageMaker Pipelines is an effort for trying to streamline and package all those different methodologies together for machine learning pipeline creation.

It’s a great fit if you work with batch learning models and want to create machine learning pipelines really fast. If you’re working with online learning or reinforcement models you’ll need a custom solution. And if you are adamant that you need autoscaling then you need to do the API deployments yourself, SageMaker endpoints aren’t quite there yet. For references to a “complete” architecture refer to the AWS blog https://aws.amazon.com/blogs/machine-learning/automate-model-retraining-with-amazon-sagemaker-pipelines-when-drift-is-detected/


super

Industrial data contextualization at scale

Shaping the future of your data culture with contextualization


My colleague and good friend Marko had interesting thought on Smart and Connected factories  and how to get data out of the complex factory floor systems and enable machine learning capabilities on Edge and Cloud . In this blog post I will try to open a bit more on data modeling and how to overcome a few typical pitfalls – that are not always only data related.

Creating super powers

Research and development (R&D) include activities that companies undertake to innovate and introduce new products and services. In many cases if company is big enough R&D is separate from other units and in some cases R is separated from D as well. We could call this as separation of concerns –  so every unit can 100% focus on their goals.

What separates R&D and Business unit ? Let’s first pause and think about what business is doing. A business unit is an organizational structure such as a department or team that produces revenues and is responsible for costs. Perfect so now we have company wide functions (R&D, business) to support being innovative and produce revenue.

Hmmm, something is still missing – how to scale digital solutions in a cost efficient way so we can have profit (row80) in good shape ? Way back in 1978 information technology (IT) was used first time. The Merriam-Webster Dictionary defines information technology as “the technology involving the development, maintenance, and use of computer systems, software, and networks for the processing and distribution of data.” One the IT functions is to provide services with cost efficiency on global scale.

Combine these super powers: business, R&D and IT we should produce revenue, be innovative and have the latest IT systems up and running to support company goals – in real life this is much more complex, welcome to the era of data driven product and services.


Understanding your organization structure 

To be data driven, the first thing is to actually look around in which maturity level my team and company is. There are so many nice models to choose from: functional, divisional, matrix, team, and networking.  Organizational structure can easily become a blocker in how to get new ideas to market quickly enough. Quite many times Conway’s law kicks in and software or automated systems end up “shaped like” the organizational structure they are designed in or designed for.

One example of Conway’s law in action, identified back in 1999 by UX expert Nigel Bevan, is corporate website design: Companies tend to create websites with structure and content that mirror the company’s internal concerns

When you look at your car dashboard, company web sites or circuit board of embedded systems, quite many times you can see Conway’s law in action. Feature teams, tribes, platform teams, enabler team or a component team – I am sure you have at least one of these to somehow try to tackle the problem of how an organization should be able to produce good enough products and services to market on time. Calling same thing with Squad(s) will not solve the core issue. Neither to copy one top-down driven model from Netflix to your industrial landscape.


Why does data contextualization matter?

Based on facts mentioned above, creating industrial data driven services is not easy. Imagine you push a product out to the market that is not able to gather data from usage. Other team is building a subscription based service for the same customers. Maybe someone already started to sell that to customers. This solution will not work because now we have a product out and not able to invoice customers from usage. Refactoring of organizations, code and platforms is needed to accomplish common goals together. A new Data Platform as such is not improving the speed of development automatically or making customers more engaged.

Contextualization means adding related information to any data in order to make it more useful. That does not mean data lake, our new CRM or MES. Industrial data is not just another data source on slides, creating contextual data enables to have the same language between different parties such as business and IT. 

A great solution will help you understand better what we have or how things work, it’s like a car you have never driven and still you feel that this is exactly how it should be even if it’s not close to your old vehicle at all. Industrial data assets are modeled in a certain way and that will enable common data models from floor to cloud, enabling scalable machine learning without varying data schema changes.

Our industrial AWS SiteWise data models for example are 100% compatible with modern data warehousing platforms like Solita Agile Data Engine out of the box. General blueprints of data models have failed in this industry many times, so please always look at your use case also from bottom up and not only the other way round.

Curiosity and open minded

I have been working on data for the last 20 years and on the industrial landscape half of that time. Now it’s great  to see how Nordics companies are embracing company culture change, talking about competence based organization, asking from consultants more than just a pair of hands and creating teams of superpowers.

How to get started on data contextualization ?

  1. Gather your team and check how much of time it will take to have one idea to customer (production) – is our current organization model supporting it ?
  2. Look models and approach that you might find useful like intro for data mesh or a  deep dive – the new paradigm you might want to mess with (and remember that what works for someone else might not be perfect to you)
  3. We can help with with AWS SiteWise for data contextualization. That specific service is used to create virtual representations of your industrial operation with AWS IoT SiteWise assets.

I have been working on all major cloud platforms and focusing on AWS.  Stay tuned for the next Blog post explaining how SiteWise is used for data contextualization. Let’s keep in touch and stay fresh minded.

Our Industrial data contextualization at scale Kickstart


Factory Floor and Edge computing

Happened last time

In the first part of this blog series I discussed the industry 4.0 phenomenon: Smart and Connected Factory, what benefits it brings, what is IT/OT convergence and gave a short intro about Solita’s Connected Factory Kickstart

This part is more focused on the data at Factory floor and how AWS services can help in ingesting the data from factory machinery.

Access the data and gain benefits from Edge computing

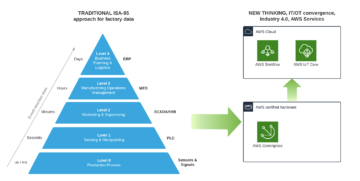
So what is the data at the Factory floor? It is generated by machinery systems using many sensors and actuators. See the following picture where on the left there is a traditional ISA-95 pyramid for factory data integrating each layer with the next. The right side represents new thinking where we can ingest data from each layer and take advantage of IT/OT convergence using AWS edge and cloud services.

PLC (Programmable Logic Controller) typically has dedicated modules for inputs and dedicated modules for outputs. An input module can detect the status of input signals like switches and an output module controls devices such as relays and motors.

Sensors are typically connected to PLC’s. To access the data and use it in other systems, PLC’s can be connected to an OPC-UA server. The server can provide access to the data. One traditional use case is to connect PLC to factory SCADA systems for high level supervision of machines and processes. OPC-UA defines a generic object model and each object can be associated with data type, timestamp, data quality and current value and they can have a hierarchy. Every kind of device, function, and system information can be described using this meta model.


AWS services that ease data access at the factory

AWS Greengrass is an open source edge software which integrates to AWS Cloud. It enables local processing, messaging, Machine Learning (ML) inference, device mesh and many pre-baked software components for speed up application development. 

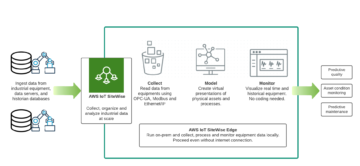
AWS Sitewise is a cloud service for collecting and analyzing data from factory environments. It provides Greengrass compatible edge components for example for data collection from OPC-UA server and for streaming data to AWS Sitewise. Sitewise has a built in time-series database, data modeling capabilities, API layer and portal, which can be deployed and run at the edge as well (which is amazing!). 

The AWS Sitewise asset and data modeling is for making a virtual presentation of industrial equipment or process. Data model supports hierarchies, metrics and real time calculations, for example for calculating OEE (Overall Equipment Effectiveness). Each asset is enforced to use data mode that validates incoming data and schema.

Why industrial use cases with AWS?

I prefer more hands-on work than reading Gartner papers; anyhow AWS has been named as a Leader for the eleventh consecutive year and has secured the highest and furthest position on the ability to execute and completeness of vision axes in the 2021 Magic Quadrant for Cloud Infrastructure and Platform Services. It’s very nice to see how AWS is taking industrial solutions seriously and packaging those to a model that is easy to take in use for building digital services to the factory floor and cloud.  

 1. AWS Sitewise – The power of data model, ingest, analyze and visualize

Sitewise packages nice features which I feel are the greatest are the data and asset modeling, near real time metric calculations (even on edge), visualization and build in time series database. Sitewise is nicely supported by CloudFormation, so you can automate the deployment and even build data models according to your OPC-UA data model automatically (Meta driven Industry standard data model). The Fact that there are edge processing and monitoring capabilities with a portal available makes the Sitewise a really competitive package.

2. AWS Greengrass – Edge computing and secure cloud integration

Speeds up edge application development with public components, like the OPC-UA collector, StreamManager and Kinesis Firehose publisher. The latest Greengrass version 2.x has evolved and has lots of great features. You can provision and run a solution on real hardware or simulate on an EC2 instance or Docker, as you wish. One way to provision Greengrass devices to AWS cloud is to use IoT Fleet Provisioning, where certificates for the device are created on the first connection attempt to the cloud. Applications are easy to deploy from cloud IoT Core to edge Greengrass instances. You can also run serverless AWS Lambdas at the edge, which is really superb! All in all, the complete Greengrass 2.0 package will speed up development.

3. Cloud and Edge – Extra layer of Security

SItewise and Greengrass use AWS IoT Core security features, like certificate based authentication, IoT policies, TLS 1.2 on transport and device defender, which brings the security to a new level. It’s also possible to use custom Certificate Authorities (CA) to issue edge device certificates. Custom CA’s can be stored in AWS CloudHSM and AWS Certificate Manager. Now I can really say that security is our best friend.

4. Agile integration to other solutions

Easy way for integrating data to other solutions is to use Sitewise Edge and Cloud APIs. If you deploy Sitewise to the edge the API is usable there as well, and you can use the data for other factory systems, like MES (Manufacturing Execution System). At least I think this will combine the IT and OT worlds like never before.

5. AutoML for Edge computing

AutoML is for people like me and citizen data scientists, something that will speed up business insights when creating a lot of notebooks or python code is not needed anymore.

These AutoML services are used to organize, track and compare Machine Learning training. When auto deploy is turned on the best model from the experiment is deployed to the endpoint and the best model is automatically selected using the Bandit algorithm. Besides these Amazon SageMaker model monitor will continuously monitor the quality of your machine learning models in real time and I can focus on talking with people and not only machines. 


Stay tuned for more

I think that AWS is making it easier to combine cloud workloads with edge computing. Stay tuned for the next blog post where we dig more into the cloud side of this, including Sitewise, Asset and data model, visualization and alarms. And please take a look at the “Predictive maintenance data kickstart” if you haven’t yet:

https://www.solita.fi/en/solita-connected/


Smart and Connected Factories

Smart connected factories are a phenomenon of the fourth industrial revolution, Industry 4.0.

What is a connected factory?

Connected Factories utilizes machinery automation systems and additional sensors to collect data from manufacturing devices and processes. The data can be analyzed and processed on site at the factory, before being sent to the cloud platforms for historical and real time data analysis. Connected factory enables a holistic view for data over all customer factories. Connectivity is a key enabler of  IT/OT convergence.

Operational Technology (OT) consists of software and hardware systems that control and execute processes at the factory floor. Typically these are MES (Manufacturing Execution System), SCADA (Supervisory Control And Data Acquisition) and PLCs (Programmable Logic Controllers) at manufacturing factories. 

Whereas Information Technology (IT) refers to the information infrastructure covering network, software and hardware components for storing, processing, securing and exchanging data. IT consists of laptops and servers, software, enterprise systems software like ERPs, CRMs, inventory management programs, and other business related tools.

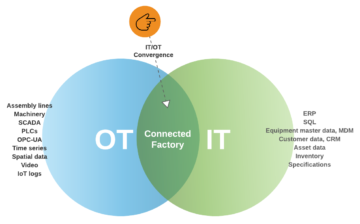
Historically OT is separated from IT. In recent years industrial digitalization, connectivity and cloud computing have made it possible for OT and IT systems to join and share data with each other. On IT/OT data convergence factory floor OT data is combined with IT data:

IT/OT Convergence
IT/OT Convergence


When IT and OT collide we need to align things like “How to handle different networks and control the boundaries between them”. IT and OT networks are totally for different purposes and they have different security, availability and maintainability principles. IT/OT convergence can definitely be beneficial for the company but at the same time it might pop up new challenges for the traditional OT world, like “How often and what kind of data should we upload to the cloud?” and “What are the key attributes to combine different data assets?”. Here are few examples where IT/OT is  converged:

  • Welding station monitoring with laboratory data. Combining with IT data we can improve customer specific welding quality. 
  • Getting OT data from equipment and merging that with customer contract data we can start upselling predictive maintenance solutions.
  • Getting real time metrics it is also possible to create subscription based billing. For this we need asset basic information and CRM customer contract information.
  • Creating a Digital service book is easy when you have full traceability based on OT data joint to IT product lifecycle data.

I think that in order to combine IT and OT together is nowadays much easier than just a few years ago thanks to hyper scalers like AWS and others. Now we can see in action how Cloud can enable smart manufacturing using purpose built components like AWS Greengrass and SiteWise. Stay tuned for next blog posts where I will explain basics on Edge computing in a harsh factory environment.


Kickstart towards smart and connected factory

Solita has made a kickstart for companies to start a risk free journey. We package pre-baked components for edge data ingestion, edge ML, AWS Sitewise data modelling, visualization, data integration API and MLOps in one deliverable using only 4 weeks time.

Check it out from https://www.solita.fi/en/solita-connected/ and let’s connect!