Introduction to Edge AI with HPE Ezmeral Data Fabric

In this blog, we will be talking about how technology has shifted from on-premises data centers to the cloud and from cloud to edge. Then, we will explain data fabric, introduce HPE Ezmeral Data Fabric and investigate its capabilities. Finally, we will talk about Edge AI with HPE Ezmeral Data Fabric.

To see what Edge AI is, we need to take a deeper look at the history of data processing over time.

The evolutions of data-intensive workloads

On-premises data centers

Back in 2000, almost everything was running locally in on-premises data centers. This means that everything from management to maintenance was on the company’s shoulders. It was fine but over time, when everything was getting more dependent on the internet, businesses faced some challenges. Here are some of the most important ones:

Infrastructure inflexibility

Over time, many new services and technologies are released and it should be taken into consideration that there might be a need to update the infrastructure or apply some changes to the services. 

This can be challenging when it comes to hardware changes. The only solution seems to be purchasing the desirable hardware, then manual configuration. It can be worse if, at some point, we realize that the new changes are not beneficial. In this case, we have to start all over again! 

This inflexibility causes wasting money and energy.

How about scaling on demand

A good business invests a lot of money to satisfy its customers. It can be seen from different angles but one of the most important ones always has the capacity to respond to the clients as soon as possible. This rule is also applied to the digital world: even loyal customers might change their minds if they see that the servers are not responding due to reaching their maximum capacity.

Therefore, there should be an estimation of the demand. The challenging part of this estimation is when this demand goes very high on some days during the year and one should forecast it. This demand forecasting has many aspects and it is not limited to the digital traffic from clients to servers. Having a good estimation of the demand for a particular item in the inventory is highly valuable.

Black Friday is a good example of such a situation. 

There are two ways to cope with this unusual high demand: 

  1. Purchase extra hardware to ensure that there will be no delay in responding to the customers’ requests. This strategy seems to be safe, but it has some disadvantages. First, since the demand is high on only certain days, many resources are in idle mode for a long time. Second, the manual configuration of the newly purchased devices should be considered. All in all, it is not a wise decision financially.
  2. Ignore that demand and let customer experience the downtime and wait for servers to become available. As it is easy to guess, it is not good for the reputation of the business.

This inflexibility is hard to address, and it gets worst over time. 

Expansion 

One might want to expand the business geographically. Along with marketing, there are some technical challenges. 

The issue with the geographical expansion is the delay that is caused by the physical distance between the clients and servers. A good strategy is to distribute the data centers around the world and locate them somewhere closer to the customers.

The configuration of these new data centers along with the security, networking, and data management might be very hard.

Cloud Computing

Having the challenges of the on-premises data centers, the first evolution of data-intensive workloads happened around 2010 when third-party cloud providers such as Amazon Web Services and Microsoft Azure were introduced. 

They provided companies with the infrastructure/services with the pay-as-you-go approach. 

Cloud Computing solved many problems with on-premises approaches. 

Risto and Timo have a great blog post about “Cloud Data Transformation” and I recommend checking it out to know more about the advantages of Cloud Computing.

Edge Computing

Over time, more applications have been developed, and Cloud Computing seemed to be the proper solution for them, but around 2020 Edge Computing got more and more attention as the solution for a group of newly-introduced applications that were more challenging. 

The common feature of these applications was being time-sensitive.  Cloud computing might act poorly in such cases since the data transmission to the cloud is time-consuming itself. 

The basic idea of Edge Computing is to process data close to where it is produced. This decentralization has some benefits such as:

Reducing latency

As discussed earlier, the main advantage of Edge Computing is that it reduces the latency by eliminating the data transmission between its source and cloud.

Saving Network Bandwidth 

Since the data is being processed in Edge Nodes, the network bandwidth can be saved. This matters a lot when the stream of data needs to be processed.

Privacy-preserving

Another essential advantage of Edge Computing is that the data does not need to leave its source. Therefore, it can be used in some applications where sending data to the cloud/on-perm data centers is not aligned with regulations.

AI applications

Many real-world use cases in the industry were introduced along with the advances in Artificial Intelligence. 

There are two options for deploying the models: Cloud-based AI and Edge AI. There is also another categorization for training the model (centralized and decentralized) but it is beyond the scope of this blog.

Cloud-based AI

With this approach, everything happens in the cloud, from data gathering to training and deploying the model.

Cloud-based AI has many advantages, such as being cost-saving. It would be much cheaper to use cloud infrastructure for training a model rather than purchasing the physical GPU-enabled computers.

The workflow of such an application is that after the model is deployed, new unseen data from the business unit (or wherever the source of data is) will be sent to the cloud, the decision will be made there and it will be sent back to the business unit.

Edge AI

As you might have guessed, Edge AI addresses the time-sensitivity issue. This time, the data gathering and training of the model steps still happen in the cloud, but the model will be deployed on the edge nodes. This change in the workflow not only saves the network bandwidth but also reduces the latency. 

Edge AI opens the doors to many real-time AI-driven applications in the industry. Here are some examples: 

  • Autonomous Vehicles
  • Traffic Management Systems
  • Healthcare systems
  • Digital Twins

Data Fabric

So far, we have discussed a bit about the concepts of Cloud/Edge computing, but as always, the story is different in real-world applications.

We talked about the benefits of cloud computing but it is important to ask these questions ourselves:

  • What would be the architecture of having such services in the Cloud/Edge?
  • What is the process of migration from on-prem to cloud? What are the challenges? How can we solve them? 
  • How can we manage and access data in a unified manner to avoid data silos?
  • How can we orchestrate distributed servers or edge nodes in an optimized and secure way?
  • How about monitoring and visualization?

Many companies came up with their own solutions for the above questions with manual work but there is a need for a better way for a business to focus on creating values, rather than dealing with these issues. This is when Data Fabric comes into the game. 

Data Fabric is an approach for managing data in an organization. Its architecture consists of a set of services that make accessing data easier regardless of its location (on-prem, cloud, edge). This architecture is flexible, secure, and adaptive.

Data Fabric can reduce the integration time, the maintenance time, and the deployment time. 

Next, we will be talking about the HPE Ezmeral Data Fabric (Data Fabric is offered as a solution by many enterprises and the comparison between them is beyond the scope of this blog).

HPE Ezmeral Data Fabric

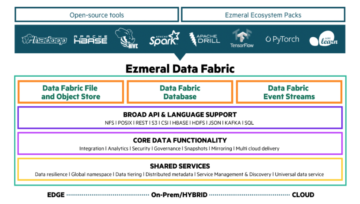
HPE Ezmeral Data Fabric is an Edge to Cloud solution that supports industry-standard APIs such as REST, S3, POSIX, and NFS. It also has an ecosystem package that contains many open-source tools such as Apache Spark and allows you to do data analysis. 

You can find more information about the benefits of using HPE Ezmeral Data Fabric here.

As you can see, there is an eye-catching part named “Data Fabric Event Stream”. This is the key feature that allows us to develop Edge AI applications with the HPE Ezmeral Data Fabric.

Edge AI with HPE Ezmeral Data Fabric – application

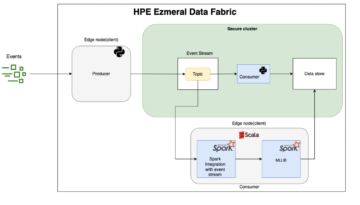
An Edge AI application should contain at least one platform for orchestrating the broker cluster such as Kafka, some tools such as Apache Spark, and a data store. This might not be as easy as it seems, especially in large-scale applications when we have millions of sensors, thousands of edge sites, and the cloud. 

Fortunately, with HPE Ezmeral Data Fabric Event Stream, this task can be done much easier. We will go through it by demonstrating a simple application that we developed. 

Once you set up the cluster, the only thing you need to do is to install the client on the edge nodes, connect them to the cluster (by a simple line maprlogin command), and then enable the services that you want to use. 

For the event stream, it is already there, and again it just needs a single command for creating a stream and then creating topics in it.

For the publisher (also called producer), you need to just send the data from any source to the broker, and for the subscriber (also called consumer) the story is the same.

For using open-source tools such as Apache Spark (or in our case Spark Structure Streaming), you just need to install them on the mapr client, and the connection between the client and the cluster will be automatically established. So you can run a script in edge nodes and access data in the cluster.

Storing data is again as simple as the previous ones. The table creation can be done with a single command, and storing it is also straightforward.

Conclusion

To sum up, Edge AI has a promising future, and leveraging it with different tools such as Data Fabric can be a game changer.

Thank you for reading this blog! I would also like to invite you to our talk about the benefits of Edge Computing in Pori on 23/09/2022!

More information can be found here.

Sadaf Nazari.

Illusion of real-time

Magic is the only honest profession. A magician promises to deceive you and he does.

Cloud data transformation

Tipi shared thoughts on how data assets could be utilized on Cloud. We had few question after blog post and one of those was “how to tackle real time requirements ?

Let’s go real time ?

Real-time business intelligence is a concept describing the process of delivering business intelligence or information about business operations as they occur. Real time means near to zero latency and access to information whenever it is required.

We all remember those nightly batch loads and preprocessing data –  waiting a few hours before data is ready for reports. Someone is looking if sales numbers are dropped and the manager will ask quality reports from production. Report is evidence to some other team what is happening in our business.

Let’s go back to the definition that says “information whenever it is required” so actually for some of the team(s) even one week or day can be realtime. Business processes and humans are not software robots so taking action based on any data will take more than a few milliseconds so where is this real time requirement coming from ?

Marko had a nice article related to OT systems and Factory Floor and Edge computing. Any factory issue can be a major pain and downtime is not an option and explained how most of the data assets like metrics and logs must be available immediately in order to recover and understand the root cause.

Hyperscalers and real time computing

In March 2005, Google acquired the web statistics analysis program Urchin, later known as Google Analytics. That was one of the customer facing solutions to gather massive amount of data. Industrial protocols like Modbus from 1970 was designed to work real time on that time and era. Generally speaking real time computing has three categories:

  • Hard – missing a deadline is a total system failure.
  • Firm – infrequent deadline misses are tolerable, but may degrade the system’s quality of service. The usefulness of a result is zero after its deadline.
  • Soft – the usefulness of a result degrades after its deadline, thereby degrading the system’s quality of service.

So it’s easy to understand that airplane turbine and rolling 12 months sales forecast have different requirements. .

What is the cost of (data) delay ?

“A small boat that sails the river is better than a large ship that sinks in the sea.”― Matshona Dhliwayo

We can simply estimate the value a specific feature would bring in after its launch and multiply this value with the time it will take to build. That will tell the economic impact that postponing a task will have.

High performing teams can do cost of delay estimation to understand which task should take first.  Can we calculate and understand the cost of delayed data? How much that will cost to your organization if service or product must be postponed because you are missing data or you can not use it.

Start defining real-time

You can easily start discussing what kind of data is needed to improve customer experience.  Real time requirements might be different for each use case and that is totally fine. It’s a good practice to specify near real time requirements in factual numbers and few examples. It’s good to remember that end to end can have totally different meanings. Working with OT systems for example the term First Mile is used when protect and connect OT systems with IT.

Any equipment failure must be visible to technicians at site in less than 60 seconds. ― Customer requirement

Understand team topologies

Incorrect team topology can block any near real time use cases. That means that adding each component and team deliverable to work together might end up having unexpected data delays. Or in the worst case scenario a team is built too much around one product / feature that will have come a bottleneck later when building more new services.

Data as a product refers to an idea where the job of the data team is to provide the data that the company needs. Data as a Service team partners with stakeholders and have more functional experience and are responsible for providing insight as opposed to rows and columns. Data Mesh is about the logical and physical interconnections of the data from producers through to consumers.

Team topologies will have a huge impact on how data driven services are built and can data land to business case purposes just on the right time.

Enable Edge streaming and APIs capabilities

On cloud services like AWS Kinesis is great, it is a scalable and durable real-time data streaming service that can continuously capture gigabytes of data per second. Apache Kafka is a framework implementation of a software bus using stream-processing. Apache Spark is an open-source unified analytics engine for large-scale data processing.

I am sure that at least one of these you are already familiar with. In order to control data flow we have two parameters: amount of messages and time. Which will come first will se served.

 Is your data solution idempotent and able to handle data delays ? ― Customer requirement

Modern purpose-built databases have capability to process streaming data. Any extra layer of data modeling will add a delay for data consumption. On Edge we typically run purpose-built robust database services in order to capture all factory floor events with industry standard data models.

Site and Cloud API is a contact between different parties and will improve connectivity and collaboration. API calls on Edge works nicely and you can have data available in less than 70-300ms from Cloud endpoint (example below). Same data is available on Edge endpoint where client response is even faster so building factory floor applications is easy.

curl --location --request GET 'https://data.iotsitewise.eu-west-1.amazonaws.com/properties/history?assetId=aa&maxResults=1&propertyId=pp --header 'X-Amz-Date: 20211118T152104Z' --header 'Authorization: AWS4-HMAC-SHA256 Credential=xxx, SignedHeaders=host;x-amz-date, Signature=xxxx

Quite many databases has built-in Data API. It’s still good to remember that underlying engine, data model and many factors will determine how scalable solution really is.

AWS GreenGrass StreamManager is a component that enables you to process data streams to transfer to the AWS Cloud from Greengrass core devices. Other services like Firehose is supported using specific aws.greengrass.KinesisFirehose component. These components will support also building Machine Learning (ML) features on Edge as well.


Conclusion

Business case will define the requirement of real time. Build your near real time capabilities according to your future proof architecture – adding real time capabilities later might come almost impossible. 

If business case is not clear enough what should I do ? Maybe a cup of tea, relax and read blog post from Johannes The gap between design thinking and business impact

You might be interested our kickstarts Accelerate cloud data transformation ​and Industrial equipment data at scale

Let’s stay fresh-minded !


Real-time BI with Power BI and Excel

New composite models capability is not just an ordinary monthly Power BI update. It is the beginning of new ways to do self-service reporting. In this blog post we explore a real-time BI solution using Excel as a dancing partner of Power BI.

Why Still Talking about Excel?

Most Power BI users probably know how to get data in from Excel. This is usually how everyone starts using Power BI and possibly the most used connection for building self-service reports. However, you might not be all familiar to the reversed process: getting data in Excel from a Power BI dataset. This sounds like a trip back to the 90’s of BI. Why would I dare to write about it?

Excel is perhaps the most well-known self-service analytical tool. Its success resides on the simplicity of getting value out of data even for non-technical fellows. After the release of Power BI, some of us thought it came to replace the king of the analytical tools.  I might accept I was wrong. Excel can still do something that Power BI can’t: to act on data.

Surprisingly, this is a very common request by Power BI users. They often might ask for changing a forecasted value in a report to see its impact on the results. There are some new solutions in Microsoft for solving this type of requests, such as Power Apps. But these tools are still not that well known, and their implementation requires developers to acquire specific training. Hence, I believe that these two, Power BI and Excel, are still going to be dancing together for some time.

A New Era after Composite Models

Not only they are good dancers, now the music sounds fantastic too. Good tunes are played since December 2020, when Microsoft announced Power BI composite models. This seems to be a great achievement in the BI world. Sincerely, I am just a beginner, so I did not see this to come. But if Alberto Ferrari says it publicly, then we must believe that this is the beginning of new BI era.


We got used to monthly updates with Power BI, but not all the months are the same. Guys, the December 2020 version of Power BI is an historical milestone in the development of Business Intelligence. Historical. Milestone. I am not saying this lightly; I am old enough to have seen many things happen in the Business Intelligence world. Some were nice, some were cool… this is neither nice nor cool: this is huge: finally, can seal the marriage between self-service and corporate BI”  –  Alberto Ferrari


With composite models, Power Bi developers connect datasets located in the cloud with new datasets saved locally in their computer. Datasets define the analytical power of our reports. But now with composite models, developers expand the limits of their data models, and consequently their analytical power too.  As Alberto said, this is a great opportunity for making self-service BI more self-service and to start doing real-time analysis. Indeed, we, as modelers, are now the obstacle for this transformation to happen.

Hints on Analysing Power BI Datasets in Excel

Accordingly, I believe that a brief refresh on how to bring data from Power BI to Excel would be beneficial.

  • Copy table. As easy as it reads. The user copies data from Power BI Desktop to Excel with a right click on the desired table. This method might be useful for a quick analysis and only if the user has access to the .pbix file.
  • Export data. This is a fast way to get data from a specific visual in Power BI. You might export data to Excel when performing own analysis on numerical values behind a visual. These are usually one-use type of analysis. The data is not connected to the Power BI dataset and any new update requires of manual work. For detailed description of the feature, visit the link https://docs.microsoft.com/en-us/power-bi/visuals/power-bi-visualization-export-data
  • Analyse in Excel. This option creates a pivot table connected to the Power BI dataset. Due to the existing live connection, Excel has access to the full Power BI data set, without row limitations, secured by Microsoft account credentials and row level security. For the same result, only available with some specific Office SKUs, Excel users click Get Data feature to connect to their available Power BI datasets. For more specific info, check Microsoft documentation in https://docs.microsoft.com/en-gb/power-bi/collaborate-share/service-analyze-in-excel
  • Power BI featured tables. You can create a connection to enterprise data so that you enrich your Excel tables. This feature is found with the name of Data Types under the Data tab. Don’t forget to set “Is featured table” to Yes in Power BI Desktop. Then  publish the dataset into the Power BI web service and ready. Full documentation about this exciting feature can be found in the following links: https://docs.microsoft.com/en-us/power-bi/collaborate-share/service-excel-featured-tables and https://docs.microsoft.com/en-us/power-bi/collaborate-share/service-create-excel-featured-tables.

A Game Changer: Excel Data Types

All these possibilities might be considered in your future use case. However, among all of them, I find the last option very relevant when seeking for real-time BI. Featured tables and Data Types allow developers to combine manually input and Power BI data in the same Excel table. Together with composite models, companies can enrich existing enterprise data models. I would rather show you how with a current customer use case.

Use Case: Leveraging CMDB in M&A Projects

The Business Case

Company A is large and international enterprise and as such, it is involved in several mergers and acquisitions (M&A) cases at a time. It seeks for leveraging the utilization of their existing configuration management database (CMDB) in their M&A projects. They aim to build a resilient virtual data room (VDR) and vendor due diligence (VDD) process. So, the company needs up-to-date reporting and multiple sources connections.

The lifecycle of the reports is long enough to fulfil the needs of the M&A project, from several months to few years. During this time, project scope and IT entities (i.e applications and workstations) change continuously. And these changes are not shown in the spreadsheets that product managers and analyst work with. Currently, these Excel files are manually updated every now and then. In addition to CMDB data, the Power BI reports include the manually input data from these Excel files. With the existing capabilities, data changes pass unnoticed, analysis are never 100% certain, and manual work slows down processes.

Company A wants to increase their capacity to do analysis on actual data while speeding up the process. This way, the company aims not only to report about individual projects, but to unify the analysis and get overall conclusions from all ongoing M&A projects.

Solution architecture

Step 1: Golden Dataset

The first step has been to build a golden dataset with all available data from an on-premises database. Generally, direct access to the on-premises data has required specific IT knowledge and skill, only available in the IT department. With golden datasets, Company A lowers the barriers for business departments to have access to relevant and secured enterprise data. To build a working architecture, we have followed Matt Allington’s fabulous post  https://exceleratorbi.com.au/new-power-bi-reports-golden-dataset/

Step 2: Export to Excel

The second step is to facilitate project managers with tools to set up the project scope. Within the golden dataset workspace, project managers have now reports to support project scoping. Project managers don’t have rights to modify the on-premises data. So they need always to communicate their changes to IT department for database updates. They use Excel to export a list of the IT elements in scope. For this, they use the Export to Excel feature actionable through the visuals in the reports.

Step 3: Setting the Workspace

Next step is about setting a new workspace for the new project. This way we restrict access to project information only to the project contributors. Only them has access to this specific workspace, which uses Teams as a collaboration environment. In this workspace, they can save their analysis tools such as Excel workbooks with their standardize tables. Additionally, they can find ready-made reports connected to the golden dataset.

Step 4: Power BI Reports

The last step is to build the Power BI reports. The reports combine data from the golden dataset and manually input data in Excel files. This is only possible due to composite models capability. The developer uses Get Data to connect to the golden dataset (Power BI dataset). And the same way to connect to the Excel shared in Teams (SharePoint folder). Power BI does the rest to establish a live and secured connection. Now the reports are ready, but not automatically up-to-date.

Bonus Step: Featured Table and Excel Data Type

For an optimally automated solution, we need to make use of Power BI featured tables. The team needs up-to-date data from the golden dataset. They want to perform their analysis without having to open many windows. Consequently they want to have the actual data available in their standardized Excel tables. Here is when new Data Type feature of Excel comes to use. They just need to include the row ID from the featured table. Finally, the rest of the data automatically appears on the dedicated columns within the Excel table.

Now always up-to-date reports are ready. The project contributors can conduct their analysis, modify the values in the Excel and see the real-time impact in the Power BI reports.

Main Take Away

As Alberto Ferrari has mentioned, composite models enable the future of real time analysis in BI. Additionally, connecting Excel tables to golden datasets brings companies enormous flexibility for building future self-service BI reports. Although not necessary, the new Power BI featured table capability was missing to obtain automated end-to-end processes. This is key to increase the speed and, more importantly, the integrity of the data.

This real case includes many new features, still in preview, so we must be still careful about their impact. But do not hesitate, try it and let’s keep learning.

And why not learning together. Have you tried to build something similar? Dis you find a better solution? What did work to you? Is there a step you wish to know more about? Please, feel free to contact us.