Data classification methods for data governance

Data classification is an important process in enterprise data governance and cybersecurity risk management. Data is categorized into security and sensitivity levels to make it easier to keep the data safe, managed and accessible. The risks for poor data classification are relevant for any business. By not following the data confidentiality policies and also preferably automation, an enterprise can expose its trusted data to unwanted visitors by a simple human error or accident. Besides the governance and availability points of view, proper data classification policies provide security and coherent data life cycles. They are also a good way to prove that your organization follows compliance standards (e.g. GDPR) to promote trust and integrity.

In the process of data classification, data is initially organized into categories based on type, contents and other metadata. Afterwards, these categories are used to determine the proper level of controls for the confidentiality, integrity, and availability of data based on the risk to the organization. It also implies likely outcomes if the data is compromised, lost or misused, such as the loss of trust or reputational damage.

Though there are multiple ways and labels for classifying company data, the standard way is to use high risk, medium risk and low/no risk levels. Based on specific data governance needs and the data itself, organizations can select their own descriptive labels for these levels. For this blog, I will label the levels confidential (high risk), sensitive (medium risk) and public (low/no risk). The risk levels are always mutually exclusive.

  • Confidential (high risk) data is the most critical level of data. If not properly controlled, it can cause the most significant harm to the organization if compromised. Examples: financial records, IP, authentication data
  • Sensitive (medium risk) data is intended for internal use only. If medium risk data is breached, the results are not disastrous but not desirable either. Examples: strategy documents, anonymous employee data or financial statements
  • Public (low risk or no risk) data does not require any security or access measures. Examples: publicly available information such as contact information, job or position postings or this blog post.

High risk can be divided into confidential and restricted levels. Medium risk is sometimes split into private data and internal data. Because a three-level design may not fit every organization, it is important to remember that the main goal of data classification is to assess a fitting policy level that works with your company or your use case. For example, governments or public organizations with sensitive data may have multiple levels of data classification but for a smaller entity, two or three levels can be enough. Guidelines and recommendations for data classification can be found from standards organizations such as International Standards Organization (ISO 27001) and National Institute of Standards and Technology (NIST SP 800-53).

Besides standards and recommendations, the process of data classification itself should be tangible. AWS (Amazon Web Services) offers a five-step framework for developing company data classification policies. The steps are:

  1. Establishing a data catalog
  2. Assessing business critical functions and conduct an impact assessment
  3. Labeling information
  4. Handling of assets
  5. Continuous monitoring

These steps are based on general good practices for data classification. First, a catalog for various data types is established and the data types are grouped based on the organization’s own classification levels.

The security level of data is also determined by its criticality to the business. Each data type should be assessed by its impact. Labeling the information is recommended for quality assurance purposes.

AWS uses services like Amazon SageMaker (SageMaker provides tools for building, training and deploying machine learning models in AWS) and AWS Glue (AWS Glue is an ETL event-driven service that is used for e.g. data identification and categorization) to provide insight and support for data labels. After this step, the data sets are handled according to their security level. Specific security and access controls are provided here. After this, continuous monitoring kicks in. Automation handles monitoring, identifies external threats and maintains normal functions.

Automating the process

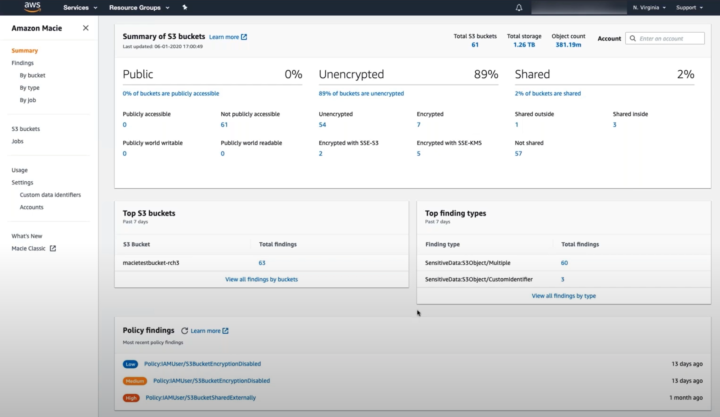
The data classification process is fairly complex work and takes a lot of effort. Managing it manually every single time is time-consuming and prone for errors. Automating the classification and identification of data can help control the process and reduce the risk of human error and breach of high risk data. There are plenty of tools available for automating this task. AWS uses Amazon Macie for machine learning based automation. Macie uses machine learning to discover, classify and protect confidential and sensitive data in AWS. Macie recognizes sensitive data and provides dashboards and alerts for visual presentation of how this data is being used and accessed.

Amazon Macie dashboard shows enabled S3 bucket and policy findings


After selecting the S3 buckets the user wants to enable for Macie, different options can be enabled. In addition to the frequency of object checks and filtering objects by tags, the user can use custom data identification. Custom data identifiers are a set of criteria that is defined to detect sensitive data. The user can define regular expressions, keywords and a maximum match distance to target specific data for analysis purposes.

As a case example, Edmunds, a car shopping website, promotes Macie and data classification as an “automated magnifying glass” into critical data that would be difficult to notice otherwise. For Edmunds, the main benefits of Macie are better visibility into business-critical data, identification of shared access credentials and protection of user data.

Though Amazon Macie is useful for AWS and S3 buckets, it is not the only option for automating data classification. A simple Google search offers tens of alternative tools for both small and large scale companies. Data classification is needed almost everywhere and the business benefit is well-recognized.

For more information about this subject, please contact Solita Industrial.

A sad person looking at a messy table with crows foot prints. Birds flying away holding silverware.

Data Academians share 5 tips to improve data management

Is your data management like a messy dinner table, where birds took “data silverware” to their nests? More technically, is your data split to organizational silos and applications with uncontrolled connections all around? This causes many problems for operations and reporting in all companies. Better data management alone won’t solve the challenges, but it has a huge impact.

While the challenges may seem like a nightmare, beginning to tackle them is easier than you think. Let our Data Academians, Anttoni and Pauliina, share their experiences and learnings. Though they’ve only worked at Solita for a short time, they’ve already got a hang of data management.

What does data management mean?

Anttoni: Good data management means taking care of your organization’s know-how and distributing it to employees. Imagine your data and AI being almost as person, who can answer questions like “how is our sales doing?” and “what are the current market trends?”. You probably would like to have the answer in a language you understand and with terms that everyone is familiar with. Most importantly, you want the answer to be trustworthy. With proper data management, your data could be this person.

Pauliina: For me data management compares to taking care of your closet, with socks, shirts and jeans being your data. You have a designated spot for each clothing type in your closet and you know how to wash and care for them. Imagine you’re searching for that one nice shirt you wore last summer when it could be hidden under your jeans. Or better yet, lost in your spouse or children’s closet! And when you finally find the shirt, someone washed it so that it shrank two sizes – it’s ruined. The data you need is that shirt and with data management you make sure it’s located where it should be, and it’s been taken care of so that it’s useful.

How do challenges manifest?

Anttoni: Bad data management costs money and wastes valuable resources in businesses. As an example of a data quality related issue from my experience: if employees are maybe not allowed, but technically able, to enter poor data into a system, like CRM or WMS, they will most likely do that at some point. This leads to poor data quality, which causes operational and sometimes technical issues. The result is hours and hours of cleaning and interpretation work that the business could have avoided with a few technical fixes.

Pauliina: The most profound problem I’ve seen bad data management cause is the hindering of a data-driven culture. This happened in real life when presenters collected material for a company’s management meeting from different sources and calculated key KPI’s differently. Suddenly, the management team had three contradicting numbers for e.g. marketing and sales performance. Each one of them came from a different system and had different filtering and calculation applied. In conclusion, decision making was delayed because no-one trusted each other’s numbers. Additionally, I had to check and validate them all. This wouldn’t happen if the company properly manages data.

Person handing silverware back to another person with a bird standing on his shoulder. They are both smiling.

Bringing the data silverware from silos to one place and modelling and storing it appropriately will clean the dinner table. This contributes towards meeting the strategic challenges around data – though might not solve them fully. The following actions will move you towards a better data management and thus your goals.

How to improve your data management?

Pauliina & Anttoni:

  1. We could fill all five bullets with communication. Improving your company’s data management is a change in organization culture. The whole organization will need to commit to the change. Therefore, take enough time to explain why data management is important.
  2. Start with analyzing the current state of your data. Pick one or two areas that contribute to one or two of your company or department KPIs. After that, find out what data you have in your chosen area: what are the sources, what data is stored there, who creates, edits, and uses the data, how is it used in reporting, where, and by whom.
  3. Stop entering bad data. Uncontrolled data input is one of the biggest causes of poor data quality. Although you can instruct users on how they should enter data to the system, it would be smart to make it impossible to enter bad data. Also pay attention to who creates and edits the data – not everyone needs the rights to create and edit.
  4. Establish a single source of truth, SSOT. This is often a data platform solution, and your official reporting is built on top of it. In addition, have an owner for your solution even when it requires a new hire.
  5. Often you can name a department responsible for each of your source system’s data. Better yet, you can name a person from each department to own the data and be a link between the technical data people and department employees.

Pink circle with a crows foot inside it and hearts around. Next to it a happy person with an exited bird on his shoulder.

About the writers:

My name is Anttoni, and I am a Data Engineer/4th year Information and Knowledge Management student from Tampere, Finland. After Data Academy, I’ll be joining the MDM-team. I got interested in data when I saw how much trouble bad data management causes in businesses. Consequently, I gained a desire to fix those problems.

I’m Pauliina, MSc in Industrial Engineering and Management. I work at Solita as a Data Engineer. While I don’t have education in data, I’ve worked in data projects for a few years in SMB sector. Most of my work circled around building official reporting for the business.


The application to the Solita Data academy is now open!

Are you interested in attending Data academy? The application is now open, apply here!

Data Governance is your way from Data minor leagues to major leagues

In the spirit of Valentine’s Day this post is to celebrate my love of Data Governance, and it is also a teaser to a future series of Data Governance related blog posts by me and other members of Solita data Governance team.

I will be copying the trend of using sports analogies, but rather than focusing on explaining the basics I want to explain what Data Governance brings to the game – why Data Governance is something for organisations to embrace, not to fear.

Data Governance can seem scary and to be all about oversight and control, but the aim of  governance is never to be constricting without a purpose!

Data Governance is established for the people and is done by people.

Think about the football players on field during the game, they should all be aware of the goal, and their individual roles. But can they also pass the ball to each other efficiently? Do they even know why they are playing all the games, and are they running around without a plan? 

Data Governance as the Backroom staff

In football it is rarely the case that players would run around aimlessly, because the team spends a lot of time not just playing, but training, strategizing, going through tactics, game plays etc. All that work done outside the actual game is just as important. Team has a manager, a coach, trainers – the Backroom staff. The staff and players work together as a team to achieve progress.

In organisations Data Management should have Data Governance as their Backroom staff to help get their “game” better.

A playbook exists to make sure the players have guidance needed to perform to their optimal level. In the playbook there are stated the rules that need to be followed. Some might be the general laws from outside, then there are the  game rules and there are detail level rules for the team itself. Players need to learn their playbook, and understand it.

The Playing field

Before getting to the roles and playbook, think about: Who needs a playbook? Where to start? Did you think “from the area where there are most issues“?  Unfortunately that is the road most are forced take, because the wake up call to start building governance is when big issues already appear. 

Don’t wait for trouble and take the easy road first. 

Instead of getting yourself into trouble by choosing the problematic areas, think about a team or function of which you can already say: These are the players on that field. This is the common goal for them. And even better if you know the owner of the team and the captain of the team, since then you already have the people who can already start working on the playbook.

If you are now thinking about the players as the people just in IT and data functions – think again! Data management is done also by people in Business processes who handle, modify, add to the data. Once there is a running governance in at least part of the organisation, you can take that as an example, and take the lessons learned to start widening the scope to problematic areas.

Conclusion

Organisations are doing data management and perhaps already doing data governance, but how good is their Data Management depends on their governance. 

Data Management without governance is like playing in the minors not in the major leagues.

In the next posts on this theme, we will dive into figuring out who is the coach, and other members of the Backroom staff, and what are their responsibilities. We will have a closer look on the content of the playbook, and how you can start building a playbook, that is the right fit for your organisation.  Let the journey to the major leagues begin!

 #ilovedatagovernance

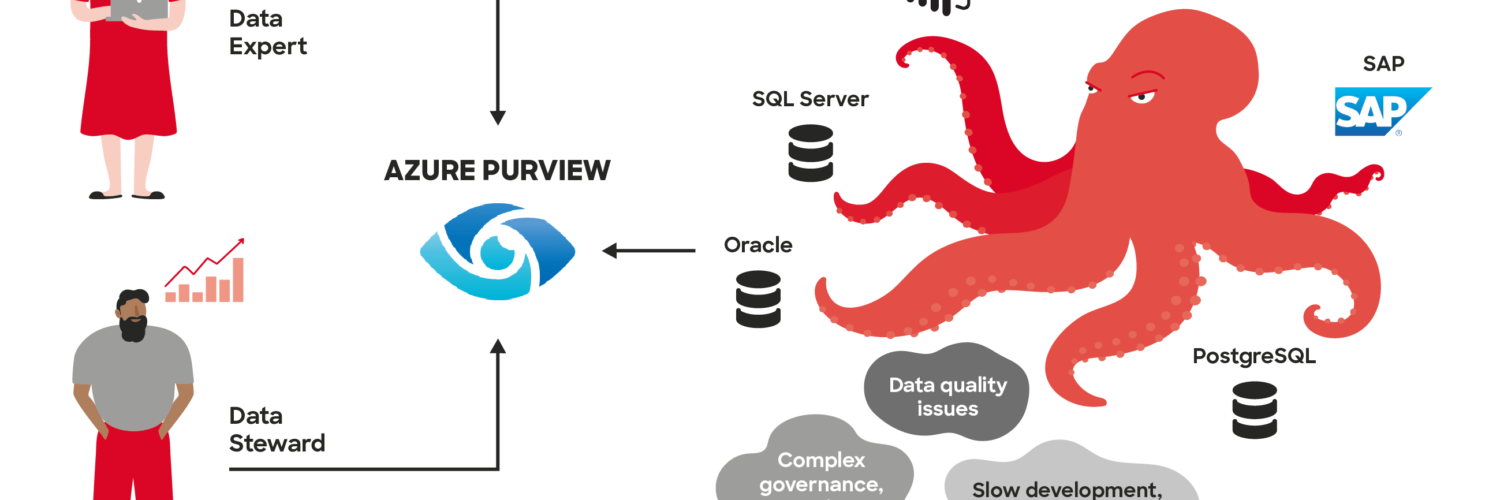
Data monster: Azure purview is for empowering different data users and connecting with different data sources. Build for hybrid world

Getting started with Azure Purview

Understanding your data is driving innovation and markets around the world. Leading companies leverage their data already so well that new products and services are fully built on data. Let's take a look at the hottest Azure service on the market Azure Purview. First let's see what the promise of the service is and then let's dive into the product itself.

Over the last few years, Microsoft has brought several different data solutions to the Azure platform, like Data Factory, Machine learning studio, Synapse, and now Azure Purview. 

 Azure Purview is a unified data governance service that helps you manage and govern your on-premises, multi-cloud, and software-as-a-service (SaaS) data. Easily create a holistic, up-to-date map of your data landscape with automated data discovery, sensitive data classification, and end-to-end data lineage. Empower data consumers to find valuable, trustworthy data. – Microsoft 

Why Azure Purview? 

What Azure Purview tries to solve is the data discovery and lay down the foundation for data governance. The business point is that everyone wants to know how data is connected between systems and where does the data come from. A very common issue in any organization. 

  • Centralized place for all the metadata
  • Track and visualize data lineages
  • Search and find answers about your data

The core problem organizations have is a lack of data ownership. Cataloging data and having a full picture of how different sources are connected, will definitely provide better ownership and transparency. The solution works across on-premises, multi-cloud, and SaaS sources.

Currently, Purview can do three things:

Catalog:

  • Source registration, automated scanning, and classification and data discovery.

At the moment there is some limitation on what type of source you can register. The majority of Microsoft products are offered in the selection. There will be custom sources available later, this will grow very fast. (Snowflake, Oracle, Salesforce, etc.)

  • Business glossary and lineage and lineage visualization

This area lets you see where the data is coming from and how it is connected with different systems. For example, it is possible to connect Purview with Data Factory and Power BI, so you can see the whole lineage of how data is joined, transformed, and stored in different parts of the pipeline.

Data insights:

  • Catalog insights and sensitivity insights

Combining all the metadata that you have and providing analytics and classification. This is defiantly the most interesting part, where you can also label and group different parts of your data into a collection.

Getting started 

The service is in preview, so don’t expect much. The ARM template can be found from here, There are not many things you can configure or change. If you want you can use the default parameters and deploy it to Europe west. Hopefully, there will be a similar Git integration like Data Factory has, till then source integrations will be done from the Azure portal. 

Now that we have deployed, let’s open up Azure Purview studio from Azure Portal. 

Azure Purview landing page, Knowledge center, Register sources, Browse assets and Manage glossary
Azure Purview landing page

Purview 

Dive into the data and let’s see how things work. From the left side choose source, from their registry, from credentials, you can either choose to select a key vault and search for the secrets there, but as we previously did the managed identity we already have rights to access the storage account. The best thing is that you can’t type your passwords or other credentials into the portal, like in Data factory. It forces you to use a key vault. This is the beginning of an end to hardcoded credentials? Maybe, let’s hope so!

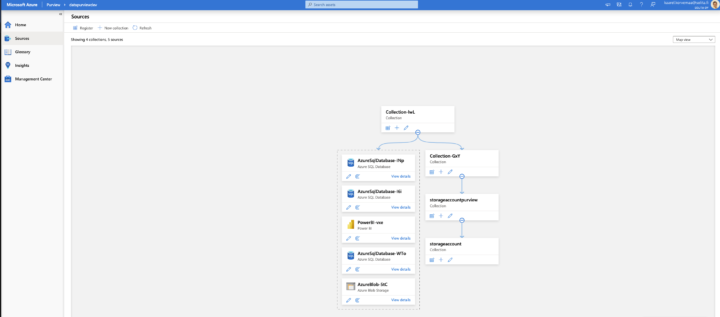
Under source you can find collections that include different sources
Source collection that can be created

Remember that whatever you choose as a source system, Purview requires a lot of rights. I like to call owner rights as God rights because it can select * from all tables, which is superuser rights. 

Scanning

Now it gets interesting, some rules are applied by default. The list is long, so the more boxes you check the longer it will take to run your scan. This will help if you are working with sensitive data and want to make sure that you comply with the regulations. Creating a new rule, allows you to specify what you want to scan and what not.

Available source connections: Azure blob storage, Azure Cosmos DB, Azure data explorer, Azure Data lake, Azure Synapse analytics, Power bi
Available sources


Remember, this isn’t a live connection. You either do a one time only scan or set a schedule. When running a scan you can do the full scan or incremental, which will search for the changes,

The assumption is that there will be some sort of an event-grid option in the future, where you can trigger scans based on data modifications.

Glossary

This is the place where you create owners for the data. You can add people who have the domain understanding and who are working with the data and how it is connected to different resources. This is the thing you connect with the scanned data. What field relates to what data and what is the definition.

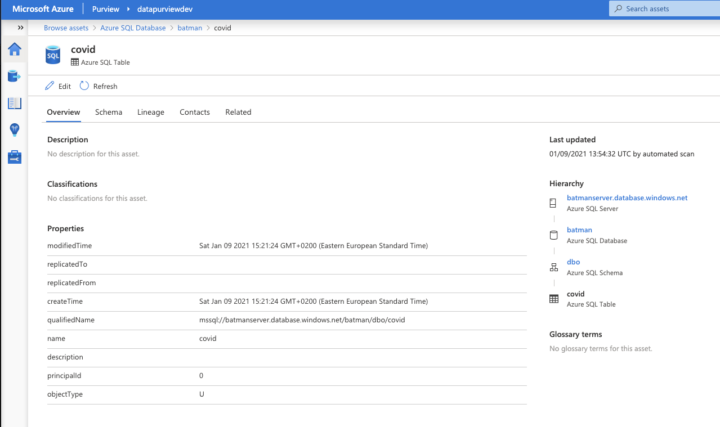
Browse assets, deep dive into how data is moved. Linage can show a hierarchy how data is delivered to end users
Browsing assets, example from Azure Sql server

Insights

I used two datasets, one is covid data and another one is credit data. The covid data didn’t automatically give any classifications, but credit data gave. Of course, you can do the classification yourself.

Assets insight, diagrams that contain data flows, amount of different sources and classification
Asset insight

Summary

Considering the amount of data circling in different silos, this will improve data ownership and transparency. At the moment it’s not a production-ready solution but very promising.

Administration level rights that are needed will become a bottleneck for individuals who would like to connect to different sources. Even getting a connection to Power Bi requires Admin level rights.

This needs to be implemented into your data strategy and data governance model. Services like this will need planning, we at Solita have delivered more than +400 different data projects over +20 years. Ping me on Linkedin, more than happy to help your organization out!

The Value of MDM – 4 Drivers For Managing Your Data

The term MDM (Master Data Management) may often have a negative echo due to the price tag it presents. This blog post aims to clarify why MDM is important by simplifying the actual value of MDM from four different perspectives.

The term MDM may often have a negative echo as it can be understood as a yet another system to buy or as a very expensive and complex process to be implemented without clear tangible value or measurable ROI (Return on Investment). Both of those interpretations could not be more wrong if you really understand what you are doing.

When talking about MDM, the first thing to understand is that MDM is not only a system – it’s a combination of roles, responsibilities and processes enabled by technology. Or how I like to think of it, MDM is a way of thinking and seeing the data management in a big picture.

Secondly, it’s true that the value of MDM is hard to prove but it does not mean that there is no value at all. To understand better the concept of MDM you can read our previous blog post Master Data Management explained. But now, lets dig deeper into the four drivers for managing your data.

1. MDM reduces costs by optimizing and automating data management processes

One of the key features of master data is that it’s used in several systems all around the organization either for operational or analytical purposes. But how is the data managed in those systems? Is it created manually or is it integrated from somewhere else?

Every time a person creates a new data record or updates an existing record it takes time. Time is money. If a new customer record is needed for five different systems, e.g. marketing, prospects, CRM, financial, data warehouse, there is a huge difference in the time it takes and costs it generates if the update is done manually in each system or once in one system that is integrated with the others. Also if the creation or update process is very complex, e.g. if approval or data enrichment is required from different persons, it takes more time, which again generates more costs.

The example in the table 1 below highlights two different scenarios for master data maintenance (incl. creation, update, deletion) costs. In the first scenario the data maintenance is done only in one central system using a simplified process. The maintained data is automatically exported to other systems that need the same data through automatic integrations.

In the second scenario there aren’t any automatic integrations so the data maintenance is done separately in all systems that need the data. Being operational systems, data maintenance often requires more or less complex processes. The time used for data maintenance includes the time required from all persons that take part in the process (e.g. creator, acceptor). The cost of the time is based on the calculation where the employee costs about 50€ per hour for the employer including salary and other costs.

SCENARIO 1:
Data maintenance to one system, optimized process, automated data integrations
SCENARIO 2:
Data maintenance to several systems, complex processes, manual data integrations
Amount of systems where data maintenance is needed 1 10
Time used for data maintenance 5 min 10 min
Cost of the time 4,17 € 8,33 €
Amount of data maintenance transactions in a year 1000 1000
Price in total in a year 4 170 € 83 300 €

Table 1. Two scenarios for master data maintenance costs.

The example above does not consider the expenses caused by the licensing costs and development costs when building the MDM capability and integrations to support the automated data integrations.

However, the example clearly shows that by minimizing the time you need for creating or updating a data record and the amount of manual work you need for the whole data management operation you can save a huge amount of money in the long run.

And imagine what other valuable work the employees could be doing if he or she didn’t have to spend time on complex data maintenance tasks in multiple systems.

On the other hand, complex data management tasks may also affect people’s mindset about the data maintaining itself. If all data maintenance tasks are really complicated, people tend to avoid them which may end up poor data quality. Easy and intuitive processes mean happy employees who can concentrate on their actual work rather than spending time on data maintenance.

2. MDM reduces costs by decreasing the friction in the operative processes

One of the clearest indicators of poor master data management is bad data quality. If the data quality is bad, it tends to cause errors in operative processes such as sales, manufacturing, shipping, etc. If for example the same customer record is saved in several systems, do you know which system has the latest and most accurate information about the customer? If the data is managed separately in each system, the operative processes may utilize different data.

As an example, a customer company has bought a product and requested direct delivery to one of its plants. The delivery address is saved to the system where the sales is handled. However, the shipping is done based on the data in the ERP system where the supply chain management is handled. If the customer data is not in sync between the sales and ERP systems there is a risk that the delivery address is incorrect in ERP. The product can be accidently sent to the customer’s headquarters instead of the plant they requested the delivery in the first place.

This kind of error obviously generates extra costs. First, the bad end result of the process needs to be fixed, e.g. the wrong delivery is re-delivered to the correct address. Second, the bad data needs to be fixed in order to avoid the error to happen again. Let’s say that fixing the error costs about 500 € including the time the employees use, re-delivering the product, compensation for the client, etc. If this is a one time thing, it’s not a big issue and the cost can be handled. But if the root cause is not fixed, it is most likely that the error will be repeated. If similar errors occur, let’s say 100 times a year, the costs are already 50 000 €.

In addition, to the direct costs mentioned above, there are also indirect costs which are often misinterpreted. For example, wrong deliveries may affect the customer’s attitude so that the next time they need something, they will turn to some other provider who can handle the delivery to the correct address. Additionally, bad experiences are often shared and in the worst case scenario also other customers or prospects may begin to doubt the trustworthy of the company and turn to competitors. At the end of the day, this may have a major impact on the sales and income.

By managing the master data, refining the data management processes and utilizing suitable technologies to support them, you can decrease the amount of errors, i.e. friction, in the operative processes caused by data issues.

For example, if the customer master data is managed only in one system and then automatically integrated to other systems utilizing that data, you can be sure that the data is in sync between the systems.

3. MDM enhances decision making by providing better visibility on high-quality data

Nowadays, business decisions are usually based on data. It can be public data which is available from news, publications, statistics, social media, etc. or it can be analysis made from operational processes (sales, deliveries, invoicing, etc.).

When talking about decisions it’s very important that one can trust the data on which the decisions are based. And more important, one should be able to connect the data to other important data domains in order see the bigger picture. The most important domains to be connected with are usually master data. For example, what do you do with sales data if you can not connect it to a customer, a product or a certain area, e.g. country?

When master data management is handled poorly, even some simple reports can be difficult to build reliably. For example, if you want to have a report including all customers, does you know in which systems the customer data is stored. And how do you know in which system the data is most reliable? Again, if you want to have a report to see which products or product types the customers have bought, are you able to combine different data domains reliably to each other with some key information. Or do you have visibility on the life cycle and validity of customer or product or other master data? Can you actually trust the data?

It’s true that in traditional data warehouse you can pretty much combine any data that is wanted as long as you find the correlation between the data objects. You can also build simple automatic match & merge logic based on decisions which sources are more trustworthy than others. However, data warehouse is used mainly for analytical purposes and it doesn’t take into account the data management aspect and the actual user who creates, updates or validates the data. Data warehouse does not either fix the data quality.

What if you could focus the power to fix the root problem instead of fixing the symptoms, and actually enhance and simplify the processes related to creating and updating the data?

With MDM you can harness the data management to enhance the quality of the data. The master data creation and update processes can be simplified so that it’s easy and pleasant to keep the master data updated. Depending on the architectural approach there still can be various sources for the master data if it’s the best fit for the business process but nevertheless the management is optimized and supports the business processes and end user experience. The overlapping processes are removed and it’s clear who updates what data and in which system. This leads to a situation where data quality issues can be pointed out and fixed already at the root and there is no need for extinguishing small fires which would jeopardize the data quality used for decision making. 

Many organizations are also thinking about overtaking big data, data science and artificial intelligence (AI) projects in order to enhance their business and getting competitive advantage. However, every data science and AI projects (as well as traditional analytics projects) are only as good as the used data and the true value comes only when one is able to connect the data to master data domains. If the data is poor quality and connections to master data are not reliable, the results and the achieved advantage are poor as well.

With MDM one can create a rock solid foundation for the business critical data which enhances all the data ventures and thus enables decision making, value creation and even new business opportunities by providing better visibility on the business through data.

The actual value what MDM brings to the decision making is very hard to calculate as the benefits come indirectly depending on how well the organization uses the MDM ecosystem. The more the valuable high-quality data is used the more benefit is gotten. For example, by offering valuable master data for machine learning purposes one can save money by optimizing maintenance processes based on the data got from the production. Or one can find a cross-selling opportunities for existing customers and create a whole new business.

The decisions made are as good as the data. Hence, with high-quality master data one can enable high-quality decisions. The actual benefits can be from tens of thousands of euros to millions. 

4. MDM helps to comply with regulations by creating a solid foundation for data management

The fourth aspect for the value of MDM is the requirements that different regulations set to data and data management. Such regulations are for example General Data Protection Regulation (GDPR) in EU and International Financial Reporting Standards (IFRS). If organizations fail to comply by those requirements, they end up paying millions of euros in fines.

As an example, the key requirements that GDPR sets for personal data processing are transparent data processing, limitations based on purpose, data subject rights, consent for data processing, notifications for breaches, privacy by design, data protection impact assessment, data transfer protection, assigning a data protection officer, and increasing the awareness and training of GDPR among the employees [1]. Hence, organizations need to have strict control of the technologies and processes that they use to collect, manage and share information about their customers, employees, suppliers and other parties that they do business with [2].

MDM helps organizations to achieve the control on the data processing required by regulations such GDPR. When MDM is implemented in the core of data management it’s clear who has access to the master data, how it can be modified, where it flows, what’s the lifecycle of the data, etc. In addition, with MDM system one can connect separate data silos into one centralized repository providing full visibility on the master data, e.g. customer or employee data. Also, the technical requirements such as privacy by design can be implemented directly to modern MDM tools to support regulations.

Even though MDM can not fully fulfill all the requirements that different regulations, such as GDPR, sets to data processing, it creates a strong basis for data management and can significantly make it easier to achieve the correct state to fulfill the regulations.

Hence, MDM saves time and money when one doesn’t have to start over every time when new regulations are set. And it can potentially save millions of euros by avoiding the huge fines for non-compliance.

Conclusions

Above we went through four different approaches why MDM is important. Of course, when thinking of the value and especially the ROI in a big picture one also needs to consider the amount of investment that is put for example into the licensing costs and development costs when building the MDM capability and integrations to support the automated data integrations.

As with many data related projects, also in MDM projects the major costs are usually realized in the very beginning of the MDM journey. Most costs are related to setting up the MDM capability, building the integrations, handling the change management, and so on. The benefits and savings however are coming over time, once the master data is under control. This means that trying to calculate a short time ROI is difficult. However, looking a bit further, using a longer time frame, let’s say 3-5 years, should be enough to get a reasonable ROI in any master data project.

Even though MDM has clear advantages, one should still remember that large scale MDM is not for everyone. Especially small organizations can handle their master data without launching separate MDM projects. However, when the organization gets bigger and the architecture and ecosystem gets more complex one needs to start looking into how the data is actually managed. Otherwise, one will end up running the business with poor data and inefficient processes and will surely get behind in the race of digitalization.

By correctly deploying continuous MDM capability one can create a supporting ecosystem, including people, processes and technologies, which enables the data initiatives by creating the structure, visibility and endurance to the data management.

References

[1] Bhatia, P. 2019. A summary of 10 key GDPR requirements. Advisera Expert Solutions Ltd. Available: https://advisera.com/eugdpracademy/knowledgebase/a-summary-of-10-key-gdpr-requirements/

[2] Assefa, B. 2018. Master Data Management for Achieving GDPR Compliance. DATAVERSITY Education, LLC. Available: https://www.dataversity.net/master-data-management-achieving-gdpr-compliance/#