Testing is always a crucial part of any Power BI development. When developing content to be embedded there are some different test angles to consider like what type of test users are needed, how RLS works in UI or what might look different after embedding. Testing is also something that needs to be done after go live and you need to have clear understanding with other stakeholders about the production release process.
In my blog seriespart 1 I described some experiences from my embed projects and issues to consider, like how to identify restrictions in Power BI to meet customer brand and functionalities not supported when content is embedded, to be prepared to manage expectations and agree what areas in the solution are developed with Power BI. The part 2 was dedicated to describe collaboration with stakeholders. This last part includes my experiences from testing and some production use considerations.
Testing, testing, testing
I am always a bit surprised how much time testing takes. When developed content to be embedded, noticed that I needed to reserve even more time for testing because testing need to be done in three different places:
Power BI desktop: data validation, functionalities, layout, performance (use also DAX Studio)
Power BI Service: gateway (if needed) and connections, monitor data refresh, Service principal access rights
UI/customer portal DEV and/or TEST environments: Same kind of testing needed as in Desktop as you might find some differences in positions or how e.g Header Icons are positioned or if there appear scroll bars need to be removed etc. If your solution will have a lot of users, then one big part of the testing is performance and load testing. Testing just mentioned requires other stakeholders input.
In “traditional” Power BI development you would do testing in the Desktop and then in the Power BI Service and maybe a bit less time is needed.
Noticed that testing needs to be done using different test users with different access rights. I asked for the different type test users and this way was able to make documentation including the information which features, reports and data each user should see. So, ensure you have all needed test users available to test different use cases.
As in traditional Power BI content development I needed to test the reports thoroughly to ensure that they work correctly and meet the user’s and brand requirements. In my projects I was able to use real production data, but of course sample test data can be used as well. With my test users I was able to simulate different scenarios and test the report’s performance under different conditions. And of course customer testers were also doing their part in the testing.
RLS testing
In my experience one of the most time consuming testing was access/visibility. Row Level Security (RLS) setup needs special attention and needs to be tested first in the Desktop and after this with many different users in the UI. This type of testing is different from the traditional Power BI Service testing/functionalities.
I also experienced that in these type solutions the RLS needs seem to change during the project. And as needs changed, I needed to do testing again for something that was already once approved.
Ways of working in testing
In my projects the Test manager/coordinator enabled a more effective adoption of testing practices. For Power BI developers working together with a Test manager/coordinator will probably mean that you are able to concentrate more on development and changes rather than sitting in testing sessions. Ensure that you have smooth communication with the Test manager/coordinator. Also consume time to show how testing should be done and what is relevant for you in test findings/notes.
Would say that consider carefully if it is useful to let the Testers do testing in Power BI Service. End user experience will not be the same in UI and testers might report wrong results. In my experience the better approach was to enable in the project a testing UI environment as soon as possible. And it is also important to get the Testers to do testing during the development phase and not just at the end of the project. This way I was able to get feedback from the tester in the early phase of the report development.
I noticed that the change and correction need to be reported in a structured way. This way I was able to see the “big picture” and plan the order and the time of the changes with other Power BI developers and UI developers. So, ensure to use clear versioning practicalities and communication channels. Otherwise you might end-up in a situation where another developer is overwriting a version and some changes are lost. The Deployment Pipeline feature could help to monitor the situation (and coming Git integration within Fabric might give even better results).
Experiences during the testing
Gathered some of my experiences from testing in my projects. Maybe these help you to tackle some obstacles beforehand.
Testing was divided into three areas: data validation, visual layout and Power BI functionalities and UI related report functionalities. I spent most of my time doing data validation like investigating source transactions and exception handling with DAX and testing different DAX solutions to meet business calculation requirements. Also gathering business logic for the calculations from different business and data owners took time.
During report development and testing, the Business owners realized there are more requirements to restrict data visibility to different types of users. RLS definitions changed many times and caused more development work and re-testing.
Noticed that the Testers needed some time to learn how testing is done and especially how to report findings. Learned that it was a good practice to have testing findings in small / many tickets rather than one huge one.
Sometimes the Testers forgot the scope of the project. So, I needed to actively ask the Business owner and Project manager what findings will be fixed and what can be added to future development lists.
The Test manager/coordinator checked frequently with the Testers and Business owner the status of test findings. We also had weekly sessions to check with the Business owner the situation and this way minimized risk of misunderstandings. Would recommend this type of way of working.
Before the Testers started the testing of a new report, we had a demo session. This way I was able to demo Power BI features/functionalities they were not so familiar with. In my experience this type of session is good to have also in the beginning of UAT testing.
Last learning for me was that having a UX Designer in the project helped to notice mistakes in layouts, colors, fonts etc.
Performance and load testing
One big part of testing might be performance testing and load testing. In many cases your reports probably work ok and the memory and CPU available within Premium capacity is enough. But if embed project reports are used by many users (thousands), data amounts are large, there are complex calculations and/or many visuals on one report page, you need to start planning the performance and load testing. Questions to the Business owner
How many users will there be?
Are there some peak moments when there are many concurrent users?
How much history data is needed on the reports?
Is it possible to reduce the amount of visuals in a report page?
Could you provide detailed level information about the business logic calculation needs?
The Business owner might not be able to answer these questions right away, but if you have heard any hints that some of the previous issues are relevant, it is best to include the performance and load testing to the project.
Production use considerations
As in all projects, you need to plan go live tasks and times. In my experience in these types of projects, it is worth considering phased production use start or if a certain pilot user group could be used. This way both customer and development team can get new improvement proposals from new users before a wide audience starts to use the reports.
You also need to discuss with the Business owner and Power BI Admin who is taking the ownership of support and alerts. If you are using e.g., dev, test and prod, maybe the support can be divided like this:
First hand support for end-users, inhouse or outsourced support team takes care
Support requests like user right problems
Owner of prod environment
Probably there is a separate tool in use within the customer to handle support tickets
“Deeper level” support where support team can contact Power BI developers
Support request requiring deep understanding about Power BI development, model, source tables etc.
Owner of dev and test environments
Probably you have your own organization support ticket tool
This is just one proposal and companies might have very different support models.
Testing in production
Another angle in production use is testing the changes and corrections. Remember to agree how future development and release is done. Consider following:
What is the timetable for releases?
Who is involved in testing? How do testers report results?
Where, how and who should be informed about the new features, reports, error corrections etc.?
How are changes documented?
Noticed that the planning of production use required many parties and many sessions. My role was more to give insights about the technical possibilities but my Project managers, Power BI admins and Business owners were dealing with other stuff like agreements.
Key takeaways
We were able to resolve complicated RLS needs where the authentication tool was not Microsoft Azure AD. This proved that Power BI is a suitable product to be used in solutions where the goal is to embed reports to your customer portal.
With ensuring enough time for testing these type of projects succeed.
Most important key takeaway was to understand how collaboration with other stakeholders ensures the best end results. Having a team around you with many skills, helps to resolve problems. Luckily in my company I was able to work with different kinds of talented people.
Development work for a customer portal is not something you can do alone. You need a project team with many skills to achieve the best result. When Power BI content is developed to be embedded, you need to collaborate with Power Service or UX designer, BI admin, Software developer, Business owner, Solution architect, Data Engineer, Project manager and Test manager.
In my blog series part 1 I described some experiences from my embed projects and issues to consider like how to identify restrictions in Power BI to meet customer brand and functionalities not supported when content is embedded, to be prepared to manage expectations and agree on what areas in the solution are developed with Power BI. This second part I dedicated to collaboration as I see it being one of the most important areas in a project where Power BI reports are embedded in a customer portal.
Tight collaboration with stakeholders
This type of development work is not done by individuals. You need to collaborate tightly with different stakeholders. Collaboration with different stakeholders can be very intensive in different phases of the project.
For example, with a UX designer, you need to use more time at the beginning of the project to plan and test layouts, json file etc. Later you will need her/his advice or opinions randomly in smaller details occurring in agile development work of individual reports. And then for example with Power BI admin your collaboration is tight in the beginning to get all accesses, connections etc. and then again at the end of the project when planning go-live and support processes.
How to make use of Service/UX designers expertise and feedback
Make sure you understand Service/UX designers’ drafts (if available) and ensure these issues are discussed:
Discuss with her/him about possible problems you recognize, like some planned layout plans are hard to accomplish in Power BI.
If a customer portal will be used via mobile phone, check and test together what is possible and what might be hard to achieve within Power BI.
Together test in Power BI different solutions to meet the brand requirements, but keep in mind also the usability and accessibility point of view.
Together use the time to create a json -theme file and test the import.
During the agile report development, I collaborated with Service/UX designer to get feedback or suggestions to resolve smaller problems in visual positions, sizes or text sizes. After I had published a report for testing, the Service/UX designer looked at it “with fresh eyes” and usually noticed something I had missed.
What insight you need from Power BI admin
Ask from customer Power BI admin the options and possible boundaries, like
How are they using Power BI Service?
What license model is in use?
Who can create gateway connections if needed?
Who can create Workspaces?
Does the customer allow custom visuals?
Is it ok to use the deployment pipeline process?
Will there be a dedicated premium tenant available?
Where should backup .pbit files be stored?
Overall make sure you inform the Power BI admin about the progress of the development and ask for help well in advance. I also included my Solution Architect in these discussions.
In the end part of the project, I involved the Power BI admin to plan and decide on go-live tasks and support processes.
How to pair work with Software Developer
As Power BI content, report page/pages or individual visuals will be embedded in a UI/customer portal you need to test and try different solutions together with Software developers doing the embedding. Consider these:
Clearly communicate the requirements for the Power BI embedded report to the software designer. Discuss the design and branding requirements, as well as any technical specifications, such as data sources and performance requirements.
Agree on the storage location for Power BI reports and visual’s IDs and ensure a clear communication process of updates.
Check how the report page fits into the UI and what is the best Page View option to be used.
Ensure you use the correct canvas size according to brand, but also verify that it is the best from the point of view of the report users.
Decide what areas are implemented in UI and what in Power BI. For example, a report header might be easier to maintain on the UI side if changes occur, Power BI page/sheet names need to be hidden in UI or some pre-selections in a date range are easier to do in UI.
If a customer portal will be used via mobile phone, check and test together the best Mobile layout for each report.
Review the report with the software designer and iterate based on testers’ feedback, both the technical and design aspects of the report.
During the testing phase, I noticed that sometimes for testers it was hard to recognize if the “bug” was related to Power BI or to UI. It helped to have weekly sessions with Business owner and testers. With the Software designer, I was able to smoothly discuss these in our daily sessions and/or in other communications tools.
How to ensure communication flow with Business owner
With the Business owner ensure the following:
You both understand report requirements and specifications are clear.
Reserve enough time and sessions with the customer to explore the old solution/customer portal.
Show the first draft of the new report version in the early phase to get feedback.
Ensure to have a communication channel open to ask questions and clarifications. Many times business owners forget to tell all the needed functionalities and during the development, you need to get more insights.
In my experience, it was a good practice to have the demo sessions for each report during the whole development phase in the project. In the testing phase, weekly sessions with the Business owner helped to keep track of the test results, “bug” reports and corrections.
Keep in mind other stakeholders
Some stakeholder cooperation is quite typical in all reporting-related development projects, so just briefly mentioning these:
Make sure you have a solid communication channel with the Customers data owner/developer, who understands the database, data source structure and business logic. If you are able to utilize a data warehouse, you have more possibilities to discuss with e.g., the Data Engineer which calculation could be done there or what to include in the source views.
If an old customer portal exists make sure you have contact persons to investigate and ask about the calculations logic done with the old tool. Sometimes contact can be a customer internal employee or another vendor’s representative.
Make sure to keep the Project manager and Solution architect aware of the technical obstacles you are facing or problems with testing resources. These stakeholders usually take care of the communication with other stakeholders like the customer’s management or testers.
Have recognized two other stakeholders, the Test manager/coordinator and Tester, but explain some insight related to them in the last part of my blog series.
I’ve collaborated with all stakeholders described above in my projects but this is not a complete list. For example, your customer organization model affects the number of stakeholders you need to collaborate with.
In the last part of my blog series I will tell you about my experiences in testing and support process planning for this type of solution.
Nowadays many companies are providing services where their B2B customers can investigate and monitor their data in a customer portal. Data could be related to purchases, product quality, delivery times, invoices etc. This type of data and content can be provided to the customer portal B2B users with BI tools, one of them Power BI.
Developing content for this type of solution includes several topics to consider as with “traditional” Power BI development to be shared via Power BI Service. First you need to identify user requirements. Then you spend time understanding data and identifying the data sources, the relationships between them, and the types of data your working with. After this you’re able to clean and transform the data to ensure that it is accurate, complete, and consistent. Next you need to design a model that is optimized for performance, scalability, and usability. This involves creating the necessary tables, columns, relationships, hierarchies, and calculations to support your analysis.
When data and data model is ready, you can choose appropriate visualizations, create interactive elements such as drill-downs and filters, optimize the report layout and ensure accessibility. Finally you need to use time to test your model and visualizations to ensure that they are working correctly and meeting requirements. During the whole process you remember to document the report design, data model, and queries used in the report.
Power BI content development to embed
Power BI Premium enables report and visual embedding. In this blog series I will concentrate on the Power BI developer’s point of view on a solution using some parts from Microsoft “Embed for your customers”. These types of solutions allow developers to build an app that uses non-interactive authentication against Power BI. Usually the report users are external users, and they don’t need to sign in using Power BI credentials to view the embedded content. (If you are interested in learning more details about a software developer’s point of view, visit Microsoft’s official pagesPower BI embedded analytics Client APIs | Microsoft Learn.)
In addition to these, there are things that I needed to take into account in the development work or need my special attention. Below are my key takeaways from the Power BI development projects where the objective was to recreate the old customer portal reports. Many of these are applicable also to Qlik Sense.
Identify restrictions in Power BI to meet customer brand or other UX design requirements and contribute to the development of a good theme file (json).
Prepare to do some expectation management.
Identify functionalities not supported when Power BI content is embedded.
Agree features/functionalities development and setups done in Power BI.
Do tight collaboration with stakeholders. – Read more in the second part of my blog series.
Reserve enough time for testing. – Read more in the third part of my blog series.
Remember to plan and agree on the support process well in advance as usually there are several parties and even tools involved. – Read more in the third part of my blog series.
Power BI restrictions and UX-related requirements
Some customers’ brands might have colors not best for reports accessibility or a font type not supported by Power BI. To tackle these in my experience the development work is easiest to do with a Service/UX designer and with the person responsible for the brand. So, in the early phase of the development work make sure you identify restrictions in the tool to meet brand or other UX-related requirements
Contribute to the development of a good theme file (json). This ensures that all reports have consistent and on-brand colors, fonts, etc. Experienced later that when my customer changed brand colors, it was much easier to implement these changes to all reports. Of course, this type of thinking is relevant in “traditional” Power BI development, but when reports are published outside customer organizations, these issues tend to be even more important.
Expectation management
Prepare to do some expectation management for the customer and testers, if an old existing customer portal is recreated with a new technology. Not all functionalities of the old implementation can necessarily be implemented or they are implemented in a different way. Or the new implementation may have new features or some functionality may be better or sometimes worse compared to the old implementation. During my projects this took time as there was existing portal to be replaced.
To really understand feature and functionality requirements, reserve enough time and sessions with the Business owners or Testers to explore the old solution. In my projects I showed the first draft of the report in the early phase, to get feedback. Noticed also that sometimes the Business owner or Tester do not understand the advantages of an agile way of development. So, it did need some courage to show “not so polished” report versions.
If a totally new customer portal is created, then you probably have much more freedom to introduce visualization types and report layouts/features. But in this case, I would also prefer to demo as soon as possible the first draft version of a report.
Power BI restrictions and embedding
Ensure you know all the solution requirements and discuss them with the Solution Architect and Software developer whether they all are possible to implement. Especially some Power BI Service-related functionalities you probably need to handle outside the tool:
Export to PDF
Save favorites/bookmarks
Report Subscription
Hiding reports from certain users
Embed report size and positions in the customer portal
Functionality to move from one report to another with portal selections/dropdown lists
Agree on features/functionalities development and setups done in Power BI
These features/functionalities I needed to agree with other stakeholders if they are developed in or outside Power BI:
Report headers/titles (consider where maintenance of the name changes is easiest)
Consider if some Filter controls need to be done in the UI/customer portal. E.g., default selections in slicers.
These features/functionalities setups in Power BI need to be agreed upon and tested carefully:
The format of token values is managed outside Power BI, but need to make sure that RLS rules use the correct formats
Page view setup
Page/canvas size, Height and Width
Mobile layouts
I will continue the story about my own experiences related to tight collaboration with stakeholders, testing and support process planning in the next parts of my blog series.
Industries have resorted to use AI partner services to fuel their AI aspirations and quickly bring their product and services to market. Choosing the right partner is challenging and this blog lists a few pointers that industries can utilize in their decision making process.
Large investments in AI clearly indicate industries have embraced the value of AI. Such a high AI adoption rate has induced a severe lack of talented data scientists, data engineers and machine learning engineers. Moreover, with the availability of alternative options, high paying jobs and numerous benefits, it is clearly an employee’s market.
Market has a plethora of AI consulting companies ready to fill in the role of AI partners with leading industries. Among such companies, on one end are the traditional IT services companies, who have evolved to provide AI services and on the other end are the AI start-up companies who have backgrounds from academia with a research focus striving to deliver the top specialists to industries.
Considering that a company is willing to venture into AI with an AI partner. In this blog I shall enumerate what are the essentials that one can look for before deciding to pick their preferred AI partner.
AI knowledge and experience: AI is evolving fast with new technologies developed by both industries and academia. Use cases in AI also span multiple areas within a single company. Most cases usually fall in following domains: Computer vision, Computer audition, Natural language processing, Interpersonally intelligent machines, routing, and motion and robotics. It is natural to look for AI partners with specialists in the above areas.
It is worth remembering that most AI use cases do not require AI specialists or super specialists and generalists with wide AI experience could well handle the cases.
Also specialising in AI alone does not suffice to successfully bring the case to production. The art of handling industrial AI use cases is not trivial and novice AI specialists and those that are freshly out of University need oversight. Hence companies have to be careful with such AI specialists with only academic experience or little industrial experience.
Domain experience: Many AI techniques are applicable across cases in multiple domains. Hence it is not always necessary to seek such consultants with domain expertise and often it is an overkill with additional expert costs. Additionally, too much domain knowledge can also restrict our thinking in some ways. However, there are exceptions when domain knowledge might be helpful, especially when limited data are available.
A domain agnostic AI consultant can create and deliver AI models in multiple domains in collaboration with company domain experts.
Thus making them available for such projects would be important for the company.
Problem solving approach This is probably the most important attribute when evaluating an AI partner. Company cases can be categorised in one of the following silo’s:
Open sea: Though uncommon, it is possible to see few such scenarios, when the companies are at an early stage of their AI strategy. This is attractive for many AI consultants who have the freedom to carve out an AI strategy and succeeding steps to boost the AI capabilities for their clients. With such freedom comes great responsibility and AI partners for such scenarios must be carefully chosen who have a long standing position within the industry as a trusted partner.
Straits: This is most common when the use case is at least coarsely defined and suitable ML technologies are to be chosen and take the AI use case to production. Such cases often don’t need high grade AI researchers/scientists but any generalist data scientist and engineer with the experience of working in an agile way can be a perfect match.
Stormy seas: This is possibly the hardest case, where the use case is not clearly defined and also no ready solution is available. The use case definition is easy to be defined with data and AI strategists, but research and development of new technologies requires AI specialists/scientists. Hence special emphasis should be focused on checking the presence of such specialists. It is worth noting that AI specialists availability alone does not guarantee that there is a guaranteed conversion to production.
Data security: Data is the fuel for growth for many companies. It is quite natural that companies are extremely careful with safeguarding the data and their use. Thus when choosing an AI partner it is important to look and ask for data security measures that are currently practised with the AI partner candidate organisation. In my experience it is quite common that AI specialists do not have data security training. If the company does not emphasise on ethics and security the data is most likely stored by partners all over the internet, (i.e. personal dropbox and onedrive accounts) including their private laptops.
Data platform skills: AI technologies are usually built on data. It is quite common that companies have multiple databases and do not have a clear data strategy. AI partners with inbuilt experience in data engineering shall go well, else a separate partner would be needed.
Design thinking: Design thinking is rarely considered a priority expertise when it comes to AI partnering and development. However this is probably the hidden gem beyond every successful deployment of AI use case. AI design thinking adopts a human centric approach, where the user is at the centre of the entire development process and her/his wishes are the most important. The adoption of the AI products would significantly increase when the users problems are accounted for, including AI ethics.
Blowed marketing: Usually AI partner marketing slides boast about successful AI projects. Companies must be careful interpreting this number, as often major portions of these projects are just proof of concepts which have not seen the light of day for various reasons. Companies should ask for the percentage of those projects that have entered into production or at least entered a minimum viable product stage.
Above we highlight a few points that one must look for in an AI partner, however what is important over all the above is the market perception of the candidate partner, and as a buyer you believe there is a culture fit, they understand your values, terms of cooperation, and their ability to co-define the value proposition of the AI case. Also AI consultants should stand up for their choices and not shy away from pointing to the infeasibility and lack of technologies/data to achieve desired goals set for AI use cases fearing the collapse of their sales.
Finding the right partner is not that difficult, if you wish to understand Solita’s position on the above pointers and looking for an AI partner don’t hesitate to contact us.
Author: Karthik Sindhya, PhD, AI strategist, Data Science, AI & Analytics,
Tel. +358 40 5020418, karthik.sindhya@solita.fi
This blog post will serve as an overview of the capabilities to give you insight on how to position Synapse Analytics to your overall data platform architecture. We won’t do a deep dive to technical implementation in this post.
Kirjoittaja:Mikko Sulonen Data Engineer
Kirjoittaja:Joni LuomalaData Architect, Azure Data Platform Tech Lead
Azure SQL capabilities have evolved a lot over the years. Azure offers everything from VMs for running your own SQL Server setup, to SQL DB Hyperscale where you are getting your extremely scalable, but still traditional, DB as a service. But what about massively parallel processing data warehousing? Data integrations? Data science? What about limitless analytics? For that, there’s Azure Synapse Analytics.
In November 2019 Microsoft announced Azure Synapse as limitless analytics service and the next evolution of SQL Data Warehouse. Only thing released in GA was re-naming of SQL DW. Other synapse features were only available in limited private preview and for most setting up Synapse Analytics meant setting up former SQL DW. Nowadays Azure Synapse Analytics is a name for the whole analytics service with former SQL DW being part of it. While writing this blog the former SQL DW (also known as Synapse SQL provisioned) is still the only thing in GA, rest of the features are in public preview and anyone can set up Synapse Analytics workspace. Yes, the naming is confusing but hang on, we will try to clear that for you.
This blog post will serve as an overview of the capabilities to give you insight on how to position Synapse Analytics to your overall data platform architecture. We won’t do a deep dive to technical implementation in this post.
Synapse Analytics Architecture
Note: At the moment of writing this blog, Synapse Analytics can refer to both “Synapse Analytics (formerly SQL DW)” and “Synapse Analytics (workspace preview)” in Azure documentation. Here we are talking about unified experience in the workspace preview.
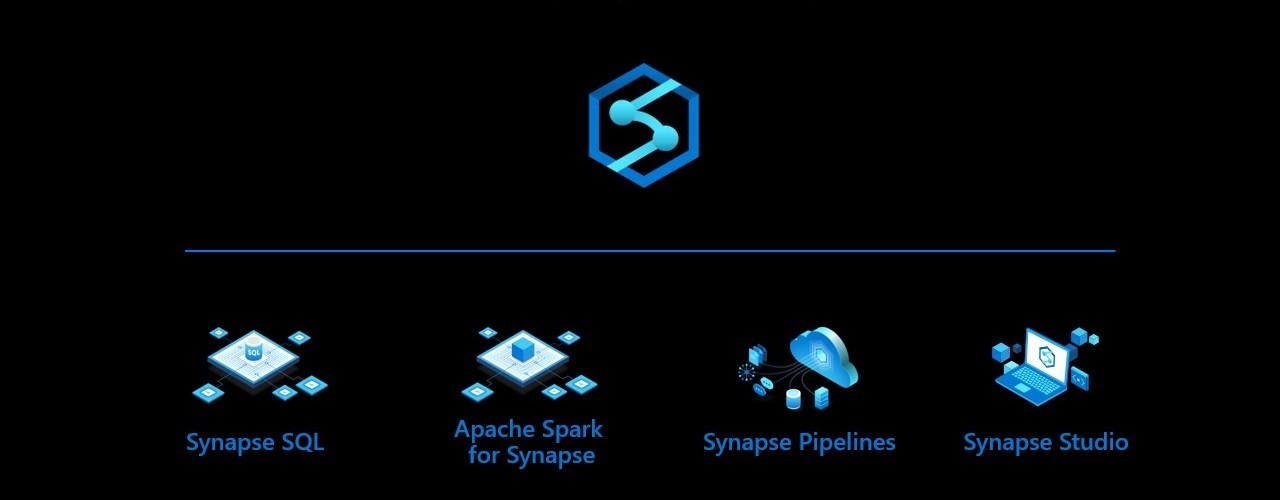
Azure Synapse Analytics is the common naming for integrated tooling providing everything from source system integration to relational databases to data science tooling to reporting data sets. Synapse Analytics contains the following
Synapse SQL
This is the data warehouse part formerly known as Azure SQL DW.
Provides both serverless (SQL on-demand) and pre-allocated (SQL Pool) resources
Shares a common metastore with the Spark engine for seamless integration
Apache Spark
Seamlessly integrated big data engine.
Shares a common metastore with Synapse SQL
Data Flow and Integrations
Shares codebase with Azure Data Factory, so has everything you expect and more
Integrate to nearly a hundred data sources to ingest data
Orchestrate SQL Procedures and Spark Notebooks
Management and Monitoring
Familiar management and monitoring tools from Azure Data Factory are available.
Synapse Studio
Single web UI where you can create everything:
Integrate to source systems
Land data to Azure Data Lake
Explore the data using Spark notebooks
Load data to Synapse SQL using T-SQL scripts
Predict what needs predicting using Python, Scala C# or SQL in Spark
Publish data sets to Power BI
Manage and orchestrate everything with pipelines
In conclusion, Synapse Analytics refers to all of the capabilities available to you and not a single included tool. Synapse SQL, as the name suggests, is perhaps the most recognizable part with the SQL DW and T-SQL. However, Synapse Analytics also contains a serverless SQL form factor named SQL On-demand. So using T-SQL no longer requires a provisioned SQL Pool.
Synapse Analytics Unique value proposal
By unifying all of the tools mentioned above, Synapse Analytics really brings something new to the table. Using Synapse Analytics you can, without ever leaving the Synapse Studio, connect to a new on-premises data source, extract, load and transform that data to Data Lake and Synapse SQL, enrich it further with ML models, and provide it for reporting usage.
Synapse Analytics provides capabilities for each of the steps in a data pipeline: ingestion, preparing data, storing, exploring, transforming and serving the data:
Ingest
If you have previously used Azure Data Factory, you will be right at home using the data integration tools in Synapse Analytics. Synapse Analytics even shares the same codebase with Data Factory, so everything you have grown accustomed to is already there (almost everything, you can check the complete differences from https://docs.microsoft.com/en-us/azure/synapse-analytics/data-integration/concepts-data-factory-differences). You can use an Integration Runtime running inside your on-premises network to access all your data sources inside your network, or an Azure hosted one for massive scale. The list of natively supported systems is constantly growing, and you can find up-to-date information from https://docs.microsoft.com/en-us/azure/data-factory/copy-activity-overview#supported-data-stores-and-formats. And if your source system is not on the list, you can always use a self hosted integration runtime with ODBC or JDBC drivers.
Despite their similarities, there’s currently no tooling to migrate ADF pipelines to Synapse Analytics Pipelines, and you can’t use the same Integration Runtime for both ADF and Synapse Analytics.
Another interesting preview feature is Azure Synapse Link. It allows you to run analytical workloads on top of operational data in Azure Cosmos DB near real time without affecting the operational usage. This means that application data in Cosmos DB is available for Synapse SQL and Spark using cloud native HTAP without building ETL workflows. https://docs.microsoft.com/en-us/azure/cosmos-db/configure-synapse-link
Prepare
After connecting to your data source, you can extract your data to Azure. There are numerous ways to organize the data in the data lake. Generally, you’ll probably want to have the original untouched data in a “raw” area, and processed and more refined data in another area.
With the new COPY INTO T-SQL command, you can use gzipped csv format to reduce the storage footprint. If using csvs, it is advisable to split large files into smaller ones, depending on your DWU capacity. And finally, you don’t have to worry about the 1 MB row limit and hard coded separator values as with PolyBase.
To really leverage all the possibilities of Synapse Analytics, you should use the parquet format in your data lake. In addition to being a compressed format, using parquet supports predicate pushdown in Synapse SQL and Spark. This greatly speeds up your exploratory queries to data lake from Synapse SQL or Spark, as you don’t have to read all the files from a given folder structure to get the rows you want. With parquet, the COPY INTO command automatically splits your files to speed up the processing.
Using Data Flows to clean and unify your data
Data Flows provide a no-code approach to transforming your data. As integrations, Data Flows are also already familiar from Azure Data Factory. With Data Flows, you could for example combine a few columns, delete a redundant one, calculate a working unique identifier and join the data with another flow before storing back to Data Lake as a processed file and also persisting it to SQL Pool table.
Explore data
Synapse Studio gives you multiple options to explore your data. We can graphically view the data lake structure, and easily get a SQL script or Spark Notebook to view the file contents just by right clicking a file.
With SQL On-demand, you can explore the contents of files without moving or importing them anywhere, and generate simple graphs in Synapse Studio UI to give you an idea of what you are looking at.
Synapse SQL, both on-demand and provisioned can be connected outside Synapse Studio with different clients using application protocols like ODBC, JDBC and ADO.NET.
In Apache Spark (example in Scala), using data from the SQL Pool is as easy as:
%%spark
val df = spark.read.sqlanalytics("SQLPool.schema.table")
This doesn’t require any configurations on Spark’s side, as the Spark and SQL are just two different runtimes operating on the same metadata and data sources.
Transform and enrich data
For transforming and enrichment, Synapse Analytics offers Spark Notebooks in addition to T-SQL. However, it has already been pretty easy to add Databricks notebooks as a part of your Azure Data Factory pipelines. With Synapse Analytics, again this integration is a bit more ready-made and easier.
One interesting possibility is SQL On-demand and it’s external tables. SQL On-demand doesn’t get access to SQL Pool’s tables (as you don’t even need to provision a SQL Pool or Synapse SQL to use SQL On-demand), but you can create external tables using T-SQL. External tables are stored as parquet backed files in Azure Data Lake Storage Gen 2. Compared to the current Azure General Availability offering, moving towards SQL On-demand and external tables in your transformations, offers serverless and fully scalable architecture. What’s the performance of external tables and SQL On-demand is going to be like, remains to be seen.
Serve
Synapse Analytics offers a few new interesting features for serving enriched data: SQL On-demand and Power BI Service connection.
With SQL On-demand, it is possible to create a highly scalable data pipeline all the way from source systems to transforming and storing data to serving it to Power BI, without any predetermined service level or capacity choices:
Ingest and Transform data using Data Pipelines and Data Flow. Use SQL On-demand or Data Flow as a part of your pipeline where needed
Store the results with “CETAS”, a T-SQL command CREATE EXTERNAL TABLE AS SELECT to store the results of your final SELECT statement to Azure Data Lake Storage Gen 2
Create a data set in Power BI. You can either use the files directly or use Direct Query via SQL On-demand.
Lastly, Synapse Analytics has the capability to link to Power BI Service! You can create linked services with Power BI Workspaces, view datasets and also create Power BI reports without ever leaving Synapse Studio. This greatly simplifies the process of creating reports from new data.
Do note that at the moment, you can only link to ONE Power BI Workspace. After connecting to a Power BI Workspace, you can create new Power BI reports based on published data sets without leaving Synapse Studio.
Manage and orchestrate
For orchestrating your pipelines, Synapse Analytics offers pretty much the same tooling as Azure Data Factory. You can easily combine your Data Flows, Spark Notebooks, T-SQL queries and everything to form pipelines as in Azure Data Factory. The familiar triggers are also there.
Management views also share much of the same as Azure Data Factory.
Synapse Analytics excels
Synapse Analytics strengths lie in it’s unified and yet versatile tooling.
Starting a new data platform project
Synapse Analytics offers an unified experience creating ingestion, preparation, transformations and serving your data in one place
Architecture with Data Lake
Synapse Analytics’s unified tooling makes it easier to work with and explore Data Lake
Architecture with Cosmos DB (or other future possible Synapse Link sources)
Near-real-time analytics based on operative data sources without any manual ETL processes
Explorative work on unknown data
Many tools and languages in one place
Security management in Synapse Workspace
Instead of setting up and configuring multiple separate tools with authentications and networks between them, you have only the Synapse Analytics workspace to setup
Possibility for both no-code and code approaches
A suitable approach probably exists for many developers to get started
Synapse SQL Pool as an MPP database
Synapse SQL is a powerful database in it’s own right
What we wish to see in future updates
While Synapse SQL Pool does pack a punch, it does require dba work and manual maintenance. Maybe more automation regarding this in the future?
Different indexes, partitions and distributions will have an impact on performance and storage costs
Workload management: classification, importance, isolation all need to be planned for and addressed for full scale operations
More dynamic resource scaling
Scaling Synapse SQL is an offline operation
While SQL On-demand offers some exciting possibilities, it fails to deliver any database functionalities: no access to relational tables for example as it doesn’t require a SQL Pool. There are parquet backed external tables, but their performance remains to be seen
Development in the Spark-sector as Synapse’s Spark is not on par with Databricks
For example, one notebook locks one Spark pool
Different runtime versions compared to Databricks
Implementation of version control
There’s no GIT or any other version control system support. The only way to save work is to publish, which also makes it visible to all other developers.
Managing different environments without version control system requires the use of SDK or APIs, which means a lot of work to get production ready
Getting from preview to GA
There still are instabilities and UI issues. The usual Preview shenanigans which are hopefully taken care of before moving to general availability.
Conclusion
In conclusion, Synapse Analytics’s vision is a great one: unified tool and experience to create almost everything you require in Azure to get your data from a data source to a published report. At the moment, there are some drawbacks as the whole workspace experience is still in preview, of which the lack of version control is definitely not the smallest.
At this point, we haven’t made any performance analysis and it is too early to say, if Synapse Analytics can really be a silver bullet for combining data pipelines, warehousing and analytics. In addition to performance, some key unique features are somewhat handicapped at this point: for example you can only connect to one Power BI Workspace. The vision is definitely there, and we will be anxiously waiting for future updates.
Power BI provides easy and readily available tools for report creation and distribution. However, distributing reports outside Power BI Service and to users without Power BI Pro account is limited. Say you have a Power BI report monitoring your Snowflake account usage (https://data.solita.fi/visualize-snowflake-warehouse-cost-using-power-bi/), and you’d like to share that to the development and maintenance team. You don’t want to purchase Power BI Pro licenses and you don’t want to open the report to the whole world. Instead you simply want to show your PBI report on a web page / in your intranet, where users can securely access it – and here’s where Power BI Embedded and Azure Web Apps come in handy!
In this blog post we’ll set up an environment with a Web App, and use a service principal (whose identity we’ll retrieve from Azure Key Vault) to access Power BI Service to retrieve a report for Embedding. All the work will result in a template that is easy to copy for new web applications to embed new reports. We’ll also take a look at some handy modifications to our Web App template for retrieving a desired report page and hiding navigation elements. You don’t need to be familiar with .NET, we’ll be doing only slight modifications to an existing Microsoft template!
Environment
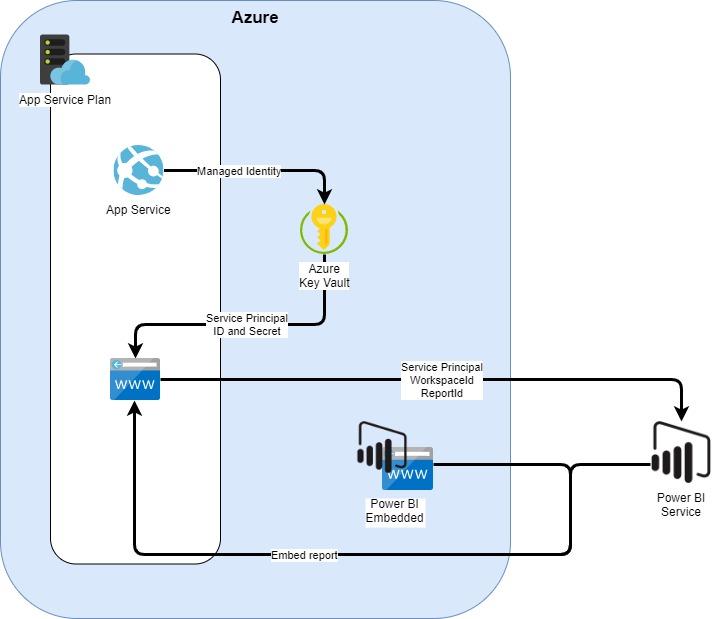
Target environment is presented in the picture below. The goal is to setup the environment in a way that it is easily reusable: for example adding a few more web applications with other reports embedded in them shouldn’t be too much of a trouble.
Power BI Embedded and Web App environment
App Service Plan
Azure App Service Plan provides a pool of resources for App Services running inside the Plan. You can view it a bit like a server farm in old on-premises systems. The main decisions to make are your App Service Plan location (West Europe, US East, etc…) and the amount and level of resources available inside that Plan: number and size of instances, pricing tier. Start small when developing and scale up as required. As always, refer to Azure documentation for up-to-date information on different service levels: https://docs.microsoft.com/en-us/azure/app-service/overview-hosting-plans
App Service
Azure App Service provides infrastructure for a single application inside an App Service Plan. Each App Service receives a URL pointing to that particular App Service: for example https://ourprojectsnowflakemonitoring.azurewebsites.net. Our embedded report is a web application running in App Service. We’ll be using App Service managed identity to identify our application to Azure Key Vault. And lastly we can use App Service network configurations to restrict access to our application.
Web application
A web application running in Azure App Service can be written in a number of languages. We’ll be using a template provided by Microsoft from https://github.com/microsoft/PowerBI-Developer-Samples/tree/master/App%20Owns%20Data. We’ll modify the template so that we can retrieve configurations from Azure Key Vault, namely our Service Principal information. We will also use application settings so we can easily copy our web app for new embedded reports.
Azure Key Vault
Key Vault provides a secure place for accessing and storing secrets. In this example, we’ll be storing our Service Principal credentials there, and allowing access to our App Service.
Service Principal
Service Principal can be seen as a technical account in Azure AD. It offers a way to authenticate as a service, not as a user. Using Service Principals to authenticate your applications to Power BI Service is a more scalable way: say you have multiple workspaces and multiple applications using the reports: creating, managing and authorising multiple service principals is simpler than multiple “Master Users”. For much more detailed documentation, please refer to https://docs.microsoft.com/en-us/power-bi/developer/embed-service-principal.
Power BI Embedded
Power BI Embedded provides Power BI capacity outside Power BI Service. We can setup workspaces to use the Embedded capacity and provide the reports to outside users via web apps. Power BI Embedded comes in three capacities: A for capacity in Azure, EM for volume licensing, and P for Premium licence. Unless you already have volume licensing or Premium capacity, you would most probably want to use A capacity bought from Azure.
Power BI Service, Workspace and Report
The Embedded report resides as usual in Power BI Service in a Workspace that is assigned to use Embedded capacity. As we are using Service Principal, our Workspace needs to be V2, and we need to allow Service Principals to use it.
Environment setup
Terraform
I’m used to creating my environments using Terraform (https://www.terraform.io/). There’s a lot of blog posts out there discussing why you should or shouldn’t use Terraform in Azure. I personally like the easy readability and reusability of it.
Using Terraform in Azure and setting up a CI/CD pipeline from Azure DevOps is a topic for another blog post. Here, we’ll focus more on setting up our environment and the different configurations we require. So don’t worry right now about the Terraform syntax, let’s focus more on the output.
We are creating an App Service Plan sized D1 and Shared tier. This is suitable for development and testing.
Then we add an App Service to previously created App Service Plan. We set the App Service to get a “System Assigned” identity. Using SystemAssigned identity, our newly created web app receives an Azure AD identity which we then authorize to access Azure Key Vault to retrieve Service Principal Secrets. This way we don’t have to authorize anything else (for example another service principal) besides the application itself to retrieve the secret.
We also set an app_settings block. These are application configurations, which will override the configurations set in code. These will become handy later on.
Creating a key vault is pretty straight forward. What is special here is that we grant “get” and “list” permissions to the system assigned identity of our App Service: the tenant_id and object_id are dynamically referencing the corresponding outputs of the system assigned identity. No need to hardcode anything.
Remember to restrict access to your web app if required. For example, restrict access to only your offices’ and vpn’s IPs.
Service Principal
Next, we need a service principal. Service principal is a technical account which accesses Power BI Service and REST APIs. It doesn’t require any licenses and it can’t login via app.powerbi.com. More info about Service Principal in Power BI Embedded context can be found from https://docs.microsoft.com/en-us/power-bi/developer/embed-service-principal.
Here the actual values are retrieved from another place. We don’t want to store sensitive information in plaintext in Terraform.
Power BI Service and Workspace
Setting up a Power BI Embedded can be a bit of a hassle and documentation is spread around. A more complete guide is a topic of it’s own blog post, so here’s a short summary of what needs to be done:
Create Power BI Embedded capacity in Azure. That means A-tier capacity (P-tier is for Premium, and EM for volume licensing). Note that Embedded capacity should be in the same region as your Power BI Service is. Don’t forget to add capacity admin.
Add Embedded capacity to your Power BI Service
Assign a Workspace V2 to Embedded capacity. As we are using Service Principals, we need to use a Workspaces V2.
Allow Service Principals in Tenant settings
Allow service principals in the Workspace with your Reports you want to Embed.
Power BI Report for Embedding
Now that everything else is ready we still need the actual report and the web page to display and embed the report. The embedded report resides as usual in Power BI Service, published in our Workspace V2 added to Embedded capacity.
Open your report, and publish it to the correct workspace. Note that you will need a Power BI Pro license to do so.
After publishing, the parameters we require for embedding are Report and Workspace Id. These you can retrieve from your published report. Open your report and look at the url:
Here the part after “groups/” is your workspace ID. The part after “reports/” is your report ID.
You might remember we had an app settings block in our web app:
Now we have empty web app capacity which has access to Azure Key Vault to retrieve Service Principal ID and secret in order to access our Power BI. All that is left is the web application itself.
Web App
Our web app will be a simple web page which shows the report from Power BI. We’ll be using the template with no further authentication. The template is called “app owns data”. It is advisable to restrict web app access to your office IPs for example.
Download a copy of the project, and open up the PowerBIEmbedded_AppOwnsData.sln in Visual Studio. The template requires some modifications:
Reference the Key Vault for secrets
Use the Key Vault as a source for configurations
Besides Key Vault, we’ll also use application settings (set before, report ID and workspace ID) as a source for configurations. This happens automatically, and doesn’t require any modifications.
Setup Azure Key Vault
Let’s add our Key Vault as a connected service:
Select the Key Vault we just created. Note, you might need to add access rights to yourself depending on your setup!
Use Key Vault as a source for configurations
Update and add NuGet packages:
You’ll want to update the already existing packages. We also need to add one NuGet package in order for us to use Azure Key Vault as a config source. Add NuGet package:
Now we want to modify our configurations. Open the web.config file. At the start of the file, add configBuilders section (modify “yourkeyvaultname” to match your keyvault). Also add configBuilders=”AzureKeyVault” to appSettings block.
For local debugging, you can add workspaceId and reportId. However, the app_settings values we previously set for web application in Azure will override anything you set in here.
    <!-- Fill Tenant ID in authorityUrl-->
    <add key="authorityUrl" value="https://login.microsoftonline.com/common/f4nnnnn-nnnn-nnnn-nnnn-nnnnnnnnnnnn" />
You need to add empty key-value pairs for every Key Vault secret you want to import! Let’s say our ServicePrincipal secret is called “servicePrincipalClientSecret”. To import it, we need to add the following line in app settings:
The actual values are fetched from Azure Key Vault.
Use configuration values in our application
Check what configuration values map to what values in application: Modify Services/EmbedService.cs In our example, we need to configure ApplicationSecret to point to servicePrincipalClientSecret, and ApplicationId to point to servicePrincipalClientId. This is at the very start of the file:
A web page should open. Click on Embed report, and it should open a report for you!
And that’s it! You’ve successfully set-up a Web App, which connects to a Key Vault using a managed identity, to get client secrets, and then uses those secrets to identify as a Service Principal to Embed a Power BI report to your web page! That was a mouthful; in other words, you are using application specific secrets the correct way and not some hard-coded human-impersonating Power BI account.
Publish our Web App
All that is left is to publish our web app:
Let’s use our previously created web app:
Click OK and then publish, and you are good to go! You might want restrict access to your web app only to your office and vpn IPs.
Some modifications
Disable filter and navigation panes from report
Say you are showing your report in a non-interactive way (a TV screen for example). You might want hide redundant filter and navigation panes from the view:
Modify Views/Home/EmbedReport.cshtml. Find the following:
You have a nice report showing on your TV with navigations and filters disabled. Nice. Now you’d like to show different pages from that report based on a URL.
Modify Controllers/HomeController.cs
Add ReportPage to EmbedReport:
public async Task<ActionResult> EmbedReport(string username, string roles, int ReportPage = 0)
The zero in ReportPage means that by default we’ll open the first page.
Modify Views/Home/EmbedReport.cshtml.
Change the end of the file from:
    // Embed the report and display it within the div container.
    var report = powerbi.embed(reportContainer, config);
To
    // Get a reference to the embedded report HTML element
    var reportContainer = $('#embedContainer')[0];

    // call load() instead of embed() to load the report while delaying the rendering process
    var report = powerbi.load(embedContainer, config);

    // when loaded event occurs, set current page then call render()
    report.on("loaded", function () {
       // console.log("loaded event executing");
        // call to get Pages collection
        report.getPages().then(
            function (pages) {
                // inspect pages in browser console
                //console.log(pages);
                // display specific page in report
                var startPage = pages[@ViewBag.ReportPage];
                config.pageName = startPage.name;
                // Call report.render() to display report
                report.render(config);
            });
    });
Now you can set the report page in the URL. Use ReportPage=<page_number_starting_from_0> as the parameter: For example “EmbedReport?ReportPage=1” would take you to the second page.
Further customization:
Embed container size and other style related: Content/style/style.css
It is possible to require users to authenticate to your Azure AD: this option is called “users’ own data” and the template is found from the same GitHub repo as our app own data example.
Publishing a new report
Now that we have a working template, publishing a new web app pointing to a new report is extremely fast and easy.
Get your new report’s report ID. Use the same workspace, or remember to add the service principal to the new Power BI workspace.
Create a new web application in Azure. It’s just copying in your Terraform: Update the reportId and workspaceId, add key vault access policy. Here we are creating a new web app called “Solita-blog-datapipeline-monitor”.
Copy our web application solution.
Open the new copy, and publish it to the new web app in Azure.
You now know what kind of environment you need to securely use Web App, Power BI Service and Power BI Embedded in Azure. You know how to do some modifications to your web app or at least where to look for more information. And after the first application, publishing a new one is just a simple matter of creating a new copy with two new parameter values.
After working with Power BI Embedded for a while I’ve grown to appreciate it’s capabilities. This was just about embedding a complete report from Power BI Service, and I’m looking forward to do some more complex work combining web applications with Power BI Embedded!
In this blog post, I'll demonstrate how you can create a Power BI report to visualize monthly Snowflake virtual warehouse costs in euros and make Snowflake costs visible even for those not having access to Snowflake console.
Kirjoittaja:Mika Heino Data Architect, Snowflake Tech Lead
At the core of Snowflake are the virtual warehouses which enable unlimited scalability for computing. Data load, integration and visualization tools can have their own virtual warehouses. You can even provide a dedicated virtual warehouse for a business analyst who wants to query the raw data by himself.
You although want to ensure that Snowflake costs won’t skyrocket due to misuse of computational power what Snowflake provides so easily and the easiest way to do this is to visualize the virtual warehouse credit costs in Power BI (or similar tool) using Snowflake’s internal data dictionary and share the dashboard for relevant parties not having access to Snowflake console.
If you open any Snowflake database, you see that Snowflake databases come with INFORMATION_SCHEMA-schema included. INFORMATION_SCHEMA is Snowflake’s own data dictionary of all the stuff which are inside the database.
LOAD_HISTORY-view, for example, contains information of all files which are loaded into Snowflake. Do you want to know who has logged into Snowflake recently and what queries he or she has done? Just visit LOGIN_HISTORYand QUERY_HISTORY-views. Insides of INFORMATION_SCHEMA have been illustrated greatly in Kent Graziano’s “Using Snowflake Information Schema” so I won’t go more into details.
Our use case is to visualize the credit cost of virtual warehouses in Euros and for this, we will need:
1) Snowflake user who has access either to ACCOUNT_USAGE -schema or desired INFORMATION_SCHEMA’s.
2) PowerBI or similar BI -tool to visualize the warehouse credit usage
Finding correct schema and values which we need.
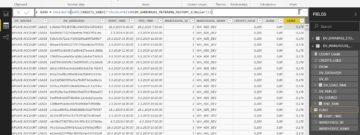
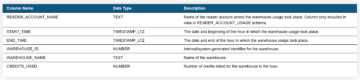
As we want to visualize credit usage of warehouses, we want to use WAREHOUSE_METERING_HISTORY-view. The view is located at two places, inside ACCOUNT_USAGE -schema and INFORMATION_SCHEMA inside every database (as information of historical and current usage of data are shared inside the account inside every INFORMATION_SCHEMA). This time we’re going to use ACCOUNT_USAGE -schema. The values which interest us are START_TIME, WAREHOUSE_NAME and CREDITS_USED.
Creating Power BI data sources
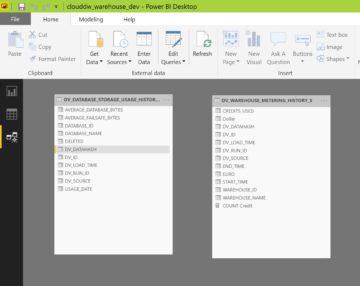
Power BI supports Snowflake, but before you can access Snowflake data, you need to download Snowflake ODBC -driver. Once you have the setup running, create a new data source using the “Get Data” -button. In my case, I have chosen “DV_WAREHOUSE_METERING_HISTORY_S” -table which is same as the WAREHOUSE_METERING_HISTORY -table, but is loaded weekly to provide historical data beyond one year.
The cost of warehouses are stored inside WAREHOUSE_METERING_HISTORY -table in CREDITS_USED column, but the Snowflake credits need to be converted into dollars and euro’s and grouped accordingly.
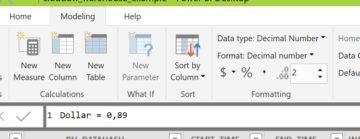
Add two new columns to the data set. Use the Modeling -tab and the “New Column” -button. Name first column as Dollar and one more column “Dollar” to the data and give it current value for dollar in euros. Currently one dollar is valued at 0,89 euros, so will give that value. In the future we can modify this value to be updated constantly, but for getting a best estimate for costs, a fixed value works fine.
Remember to give enough decimals for column so that Power BI won’t round up the value into one.
Create second column and give it name “Euro”. For this column, use following calculation. This calculation will count the sum the used credits and multiply the with the value of dollar. Outcome is the used credits in euros.
1 EURO = CALCULATE(SUM([CREDITS_USED])*CALCULATE(SUM(DV_WAREHOUSE_METERING_HISTORY_S[Dollar])))
Creating Power BI report
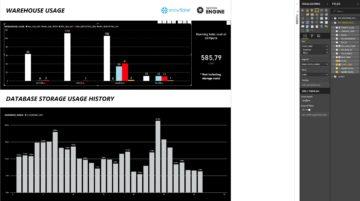
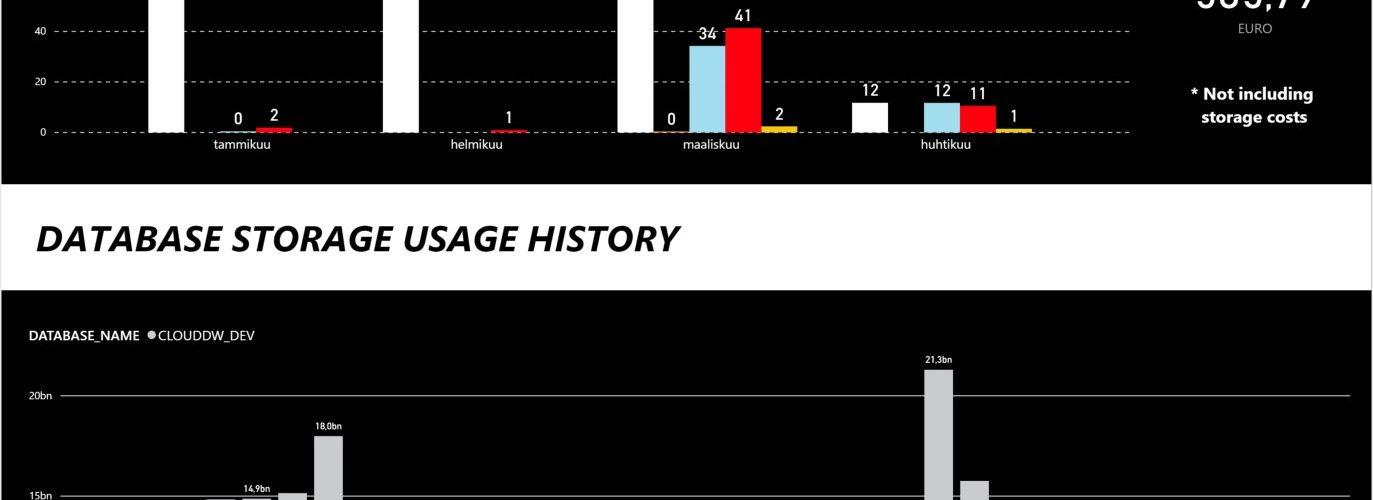
Once you have data sources ready, doing the final report is really easy. Add START_TIME (on month level) to AXIS, WAREHOUSE_NAME to LEGEND and finally EURO as value.
For this visualization, I have chosen a clustered column chart. You can add SUM of EURO to the dashboard to give it a final touch. I have also added a note that this does not include storage costs. The final result should look something like below.
Hopefully this short guidance will help you to visualize your Snowflake costs and ease the task of proofing that Snowflake is really cheap if you use it correctly.


 The cost of warehouses are stored inside WAREHOUSE_METERING_HISTORY -table in CREDITS_USED column, but the Snowflake credits need to be converted into dollars and euro’s and grouped accordingly.