Your AI partner can make or break you!

Industries have resorted to use AI partner services to fuel their AI aspirations and quickly bring their product and services to market. Choosing the right partner is challenging and this blog lists a few pointers that industries can utilize in their decision making process.


Large investments in AI clearly indicate industries have embraced the value of AI. Such a high AI adoption rate has induced a severe lack of talented data scientists, data engineers and machine learning engineers. Moreover, with the availability of alternative options, high paying jobs and numerous benefits, it is clearly an employee’s market.

Market has a plethora of AI consulting companies ready to fill in the role of AI partners with leading industries. Among such companies, on one end are the traditional IT services companies, who have evolved to provide AI services and on the other end are the AI start-up companies who have backgrounds from academia with a research focus striving to deliver the top specialists to industries.

Considering that a company is willing to venture into AI with an AI partner. In this blog I shall enumerate what are the essentials that one can look for before deciding to pick their preferred AI partner.

AI knowledge and experience:  AI is evolving fast with new technologies developed by both industries and academia. Use cases in AI also span multiple areas within a single company. Most cases usually fall in following domains: Computer vision, Computer audition, Natural language processing, Interpersonally intelligent machines, routing, and motion and robotics. It is natural to look for AI partners with specialists in the above areas.

It is worth remembering that most AI use cases do not require AI specialists or super specialists and generalists with wide AI experience could well handle the cases.

Also specialising in AI alone does not suffice to successfully bring the case to production. The art of handling industrial AI use cases is not trivial and novice AI specialists and those that are freshly out of University need oversight. Hence companies have to be careful with such AI specialists with only academic experience or little industrial experience.

Domain experience: Many AI techniques are applicable across cases in multiple domains. Hence it is not always necessary to seek such consultants with domain expertise and often it is an overkill with additional expert costs. Additionally, too much domain knowledge can also restrict our thinking in some ways. However, there are exceptions when domain knowledge might be helpful, especially when limited data are available.

A domain agnostic AI consultant can create and deliver AI models in multiple domains in collaboration with company domain experts.

Thus making them available for such projects would be important for the company.

Problem solving approach This is probably the most important attribute when evaluating an AI partner. Company cases can be categorised in one of the following silo’s:

  • Open sea: Though uncommon, it is possible to see few such scenarios, when the companies are at an early stage of their AI strategy. This is attractive for many AI consultants who have the freedom to carve out an AI strategy and succeeding steps to boost the AI capabilities for their clients. With such freedom comes great responsibility and AI partners for such scenarios must be carefully chosen who have a long standing position within the industry as a trusted partner.
  • Straits: This is most common when the use case is at least coarsely defined and suitable ML technologies are to be chosen and take the AI use case to production.  Such cases often don’t need high grade AI researchers/scientists but any generalist data scientist and engineer with the experience of working in an agile way can be a perfect match. 
  • Stormy seas: This is possibly the hardest case, where the use case is not clearly defined and also no ready solution is available. The use case definition is easy to be defined with data and AI strategists, but research and development of new technologies requires AI specialists/scientists. Hence special emphasis should be focused on checking the presence of such specialists. It is worth noting that AI specialists availability alone does not guarantee that there is a guaranteed conversion to production. 

Data security: Data is the fuel for growth for many companies. It is quite natural that companies are extremely careful with safeguarding the data and their use. Thus when choosing an AI partner it is important to look and ask for data security measures that are currently practised with the AI partner candidate organisation. In my experience it is quite common that AI specialists do not have data security training. If the company does not emphasise on ethics and security the data is most likely stored by partners all over the internet, (i.e. personal dropbox and onedrive accounts) including their private laptops.

Data platform skills: AI technologies are usually built on data. It is quite common that companies have multiple databases and do not have a clear data strategy. AI partners with inbuilt experience in data engineering shall go well, else a separate partner would be needed.

Design thinking: Design thinking is rarely considered a priority expertise when it comes to AI partnering and development. However this is probably the hidden gem beyond every successful deployment of AI use case. AI design thinking adopts a human centric approach, where the user is at the centre of the entire development process and her/his wishes are the most important. The adoption of the AI products would significantly increase when the users problems are accounted for, including AI ethics.

Blowed marketing: Usually AI partner marketing slides boast about successful AI projects. Companies must be careful interpreting this number, as often major portions of these projects are just proof of concepts which have not seen the light of day for various reasons. Companies should ask for the percentage of those projects that have entered into production or at least entered a minimum viable product stage.

Above we highlight a few points that one must look for in an AI partner, however what is important over all the above is the market perception of the candidate partner, and as a buyer you believe there is a culture fit, they understand your values, terms of cooperation, and their ability to co-define the value proposition of the AI case. Also AI consultants should stand up for their choices and not shy away from pointing to the infeasibility and lack of technologies/data to achieve desired goals set for AI use cases fearing the collapse of their sales. 

Finding the right partner is not that difficult, if you wish to understand Solita’s position on the above pointers and looking for an AI partner don’t hesitate to contact us.

Author: Karthik Sindhya, PhD, AI strategist, Data Science, AI & Analytics,
Tel. +358 40 5020418, karthik.sindhya@solita.fi

Are you building data services for the Mastermind or the Wannabe?

As in all development projects, you need to know your audience to meet their needs. Data projects are no different.

You are looking at your data platform user adaptation rate, and it is not what you expected. Are you puzzled why aren’t people jumping on board the new, more efficient data tool and ready to leave the legacy system behind?

To know where you are at, ask yourself these questions:

  • When this project was started, did I spend time on getting to know my users?
  • Am I able to tell what is their skill level and how it matches the platform capabilities
  • Do I know what are the problems the users are trying to solve with their data tools?
  • Do I understand what motivates them?

If you don’t know the answers and have a clear picture of your potential crowd, there might be something you have left undone. No worries! Read on, as we present one tool to help you to drill into these questions.

Data development is too often based on presumptions

Back in the day, web services were often designed by developers, people writing the actual code. End-user needs were typically gathered from product specialists, sales or customer service. These people brought their presumptions of the end-users to the design. User insight driven UI design was only lifting its head.

Today, the situation is somewhat different. User insight and service design have been quite well internalized in digital service development. When designing a customer facing web service, no designer wants to lean on best guesses about the end-user’s needs. Designers want to understand and experience themselves what are the motivations and underlying needs of the user.

Data projects shouldn’t really differ from digital development but in their user approach, however, they are at the same level as web design was more than ten years back.

In data projects, what is under the hood counts often more than the surface. The projects tend to rely on assumptions on the users and to some very old organizational hearsay, instead of taking a systematic approach to user insight and service design.

The reasons for this vary. First, modern data platform development projects are a relatively new phenomena, data used to be in the hands of a smaller crowd before (typically skilled specialists from finance). Now that self-service analytics have become popular, also the users are becoming more diverse. Second, the data end-users are generally internal users. The same emphasis is not put in their user experience as for services facing an external customer. This should of course not be the case since you are also trying to convert them – to change their behavior towards being data driven in their decision-making.

This is where service design tools could really help you out. With some quite basic user insight you can make some very relevant findings and change the priorities of your project to ensure maximum adoption by the end users.

How can your data project benefit from a service design approach?

To give you some food for thought on how to benefit from service design, we have drafted you something based on our work on various data projects. This is only one example of what service design tools can do for you.

Our experience and discussions from different organizations have led us to believe that there are universal data personas that apply to most data organizations. They differ in how motivated they are to change their ways of working with data and how well they master modern data development and skills. These personas are meant to inspire you to turn your eyes upon your users.

User personas are a tool widely used in service design to make the users come alive and facilitate discussion about their needs.

So, we proudly present: The Wannabe, The Enabler, The Mastermind and The Skeptic.


THE WANNABE

The Wannabe is very excited about data and craves to learn more. Is a visionary but doesn’t really quite know how to get there. Has basic data skills but is eager to learn more and be more data driven in work.

Give this user support and in return, make them your data community builder. Let them spread their enthusiasm!


THE ENABLER

The Enabler is both capable and motivated. This user is well connected in the data community and sees the advantage of collaboration and shared ways of working brings.

Keep this user close. They are the change makers due to their position in the organization as well as their attitude. Allow them to help others to grow.


THE MASTERMIND

The Mastermind is the user who doesn’t reply to your emails or show up in your workshops. This user doesn’t really need anyone’s help with data, as they have the tools and the skills already. Not very motivated to share expertise either or get connected.

Make them need you by providing help to routine work. This user requires much effort but can result in significant value in return when you can channel their exceptional skills to serve your vision. To get to the Mastermind user, use the Enabler.


THE SKEPTIC

The Skeptic knows all the things that have been tried out in the past and also how many of these have failed. Is an organizational expert and has a long history with data but feels left out.

Use some empathy, spend time with this user and listen closely. If you tackle their problem, you have a strong spokesperson and an ally, because they know everyone and everything in the organization.


As said, sketching these user personas is just one example of using design tools to change your approach. There might be people who don’t fit these descriptions and people who act in different personas depending on the project in question. The idea is to make generalizations in order to make it possible to “jump into the users’ shoes” and make different point of views more concrete.

Make the data personas work for you

So, besides changing your approach to get to different data personas, what else can you do? How can you utilize the information the personas provide you?

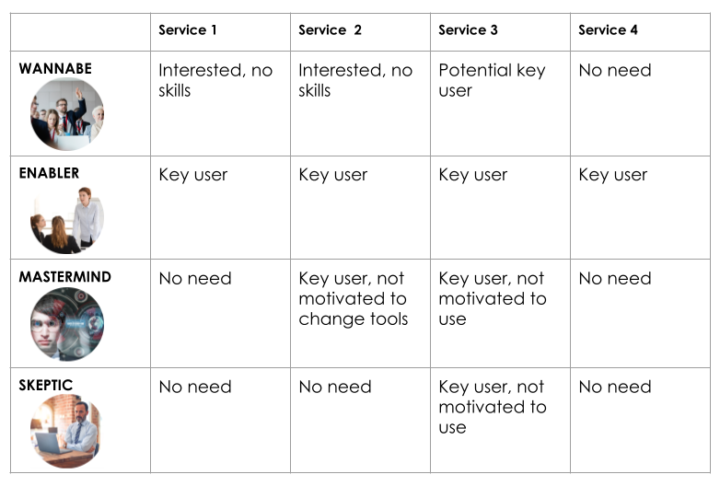
First of all, you can start by mapping your services and tools to the needs, skills and expectations of the users. You might be surprised. How many of your users are skilled to use the services you provide? Five? Is this enough? What is the relevance of their work? Does their work serve a wider group of people?

Try out this matrix below for your data services. How does the potential for your services look now?

When building data platforms, you’re actually building services

It’s about time we twist our minds into thinking about people first in data projects; what is the change you wish to see in people’s behavior. To create value, your data platform needs the users as badly as your sales need customers buying their products.

So, stop thinking about data development projects technology first. Start thinking about them as a collection of services. Find out about the users and their needs and prioritize your development accordingly. In the end of the day, people performing better by making better decisions is what you’re after, not a shining data platform that sees no usage.

The data personas are a starting point for discussion. Link this post to your colleague and ask if they identify themselves. And how about you, are you the Wannabe, the Enabler, the Mastermind or the Skeptic?


Authors of this blog post are two work colleagues, who share the same interest in looking at data services from the user perspective. At least once, they have laughed out loud at the office in such volume, that it almost disturbed co-workers in the common space. They take business seriously and life lightly.

You can contact Tuuli Tyrväinen and Kirsi-Marja Kaurala via e-mail (firstname.lastname@solita.fi) for further discussion.

Experiences from FastText in a text classification project.

FastText in a text classification project

In this blog I describe how we did text classification for funding applications with FastText package.

Describing the business need for text mining

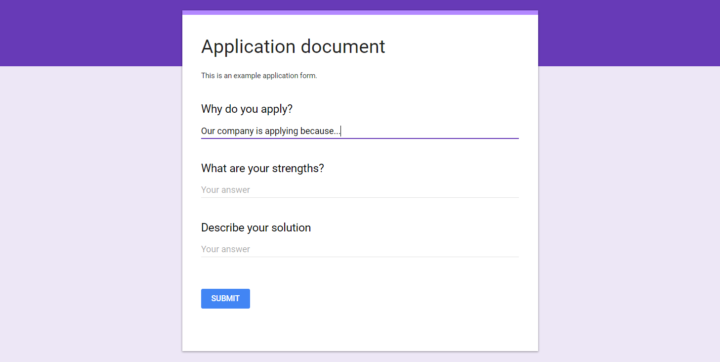
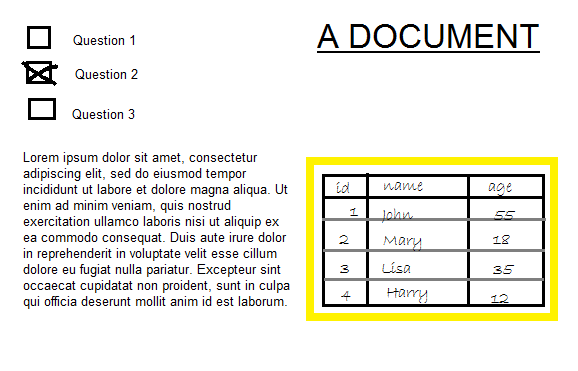
Companies applied funding with this kind of form.

Application form could have been something like this. The form is a simplified example.


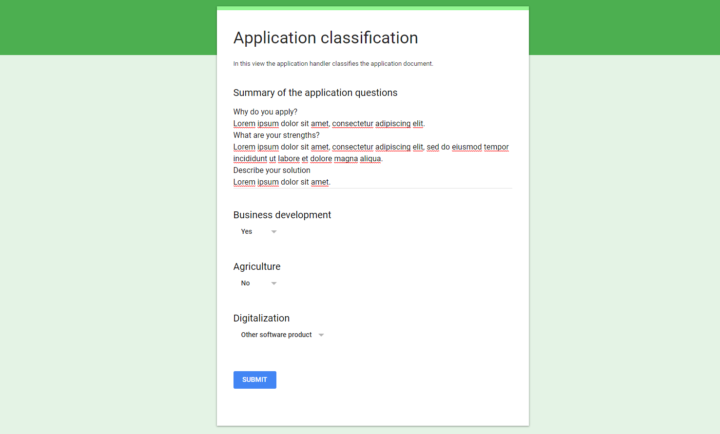
The documents were classified in a several categories by the application handler in the process management software.

The handler classified the application document in several categories base on application texts.
The human handler classified the application to categories such as Business development, Agriculture and Digitalization.


The manual process was not only time consuming, but also frustrating. Reporting was the primary reason for the classification.

Text data is often the most sensitive data

We had two primary ways of getting data.

Customer’s software was developed by Solita’s team. This made it easy to access the SQL database of the testing environment. As a result, we had all numerical and structured data in our hands. Numerical data was useful for application risk prediction, but we needed text data for document classification.

The text data was encrypted in the test database. This meant that we needed a way to securely import the plain language text data from the production SQL database.

There is a good reason why the access to text data should not be easy. Text data might contain sensitive information such as personal data or business secrets.

Selecting FastText as our text mining tool

My personal experience from text mining and classification was very thin. After discussions with the team we decided to go with the FastText package. It has been designed for simple text classification by Facebook.

FastText is quite easy command line tool for both supervised and unsupervised learning. We used a python package which apparently don’t support all original features such as nearest neighbor prediction [link].

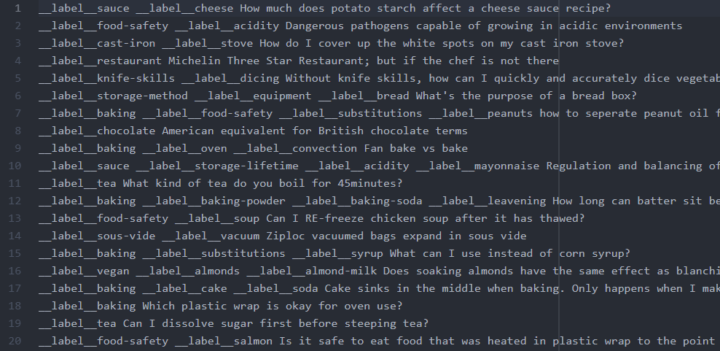
For supervised prediction you create individual text files for training and testing data [link]. After files are created, training the neural network behind FastText takes just a few lines of code. We used the supervised method to classify the applications.

Example from FastText supervised tutorial data. FastText training data has labels at the beginning of each line followed by the actual text.
FastText training data has labels at the beginning of each line followed by the actual text.


For unsupervised analysis you can just dump a bunch of text to a file to create word vectors [link]. Word vectors are useful for finding words similar to each other.

While English has either singular or plural format such as dog or dogs, Finnish language has koira, koirat, koirani, koiranne, koirienne, koirilatammekohan… There are literally tens of variations for each word. FastText is especially great for languages like Finnish where suffixes at the end of each word vary depending on the context. This is because in addition of creating features from word counts FastText can also take into account combinations of words as well as sub-word character sequences.

A model per category using a document as an observation

Each application had multiple text fields and multiple categories to automatically predict. How to approach the complex problem?

In database the there was individual row for each combination of application and text field.
In database the there was a row for each combination of application and text field.


We decided to bundle all applicable text fields from the applications together. Another option would have been to make predictions for each combination of application and text field, and then select the class with most “votes” from text field predictions.

We combined all answers to a single string and make one prediction per application.
We combined all answers to a single string and did one prediction per application.


We left out text fields such as team description. Those fields did not bring significant information for the classification.

Trying to understand the labeling principles of FastText made us scratch our heads. The initial idea was to create a single classification model. That model would have included all related labels in a single training row.

In theory this could lead to a situation where all top predictions are from the same category such as Digitalization. As we wanted to get the most probable prediction from each category, we decided to train individual model per category (Business development, Agriculture and Digitalization).

FastText supervised algorithm accuracy

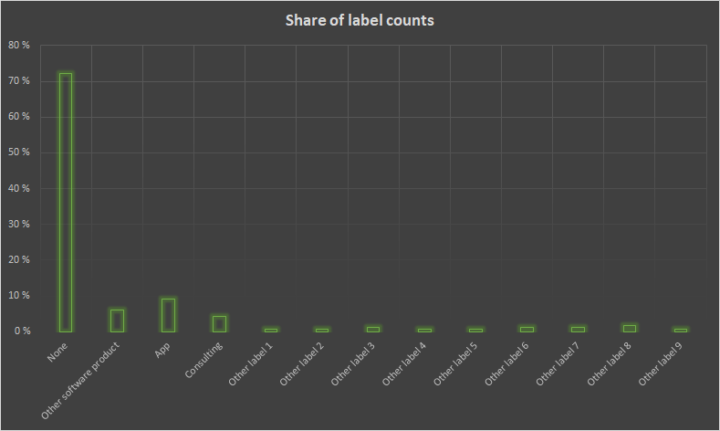
The labels inside categories were unequally balanced. Some categories had even tens of labels with very few observations.

Example of label count shares for Digitalization category.


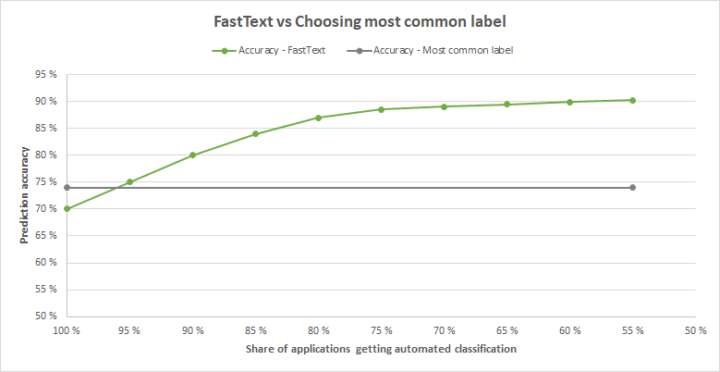
Class imbalance meant that prediction accuracy reached 50% to 90% for some categories by simply guessing the most frequent label. We took this as our base line.

Eventually our model-per-category-strategy produced a few percentage units higher accuracies than choosing the most common label. This only happened after we decided to return the weakest predictions back to manual processing. The probability of prediction’s correctness was automatically given by FastText.

In our case it was enough to beat the naive strategy of choosing the most common label.

The prediction ability of FastText increases when applications with low prediction probability are returned to manual classification.
The prediction ability of FastText increases when applications with low prediction probability are returned to manual classification. This decreases the number of applications getting automated prediction.

Summarizing the FastText classification experiment

Apparently the application handlers don’t pay too much attention about which label they choose. This made us question the whole process. What is the value of reports that are based on application handler’s hunch? And if the labeling criteria are not uniform, how could a machine find any patterns?

Let’s say there are 2000 annual applications. One of the labels gets selected 30 times per year. Binomial probability calculation reveals that 95% confidence interval for 30 labels is actually from 20 to 40. A decision maker might think that a series of 20, 30 and 40 during a three year range indicates ascending trend for the label. But in reality, it’s just a matter of random variation. In one of the categories 15 out of 20 labels had this few or less observations.

FastText favored more common labels as it increased the overall accuracy. This came with the cost that some labels never got predictions.

When the solution has ran in production for a while, it is time to see if the handlers ever make the effort to correct the machine’s initial recommendation. If not, some labels will never end up to the reports.

There are endless number of solutions to automate such document classification. In our project the fast testing cycle to try different approaches was the key. The goal was not to make perfect, but improve the existing situation.

Whatever the prediction accuracy will be, this kind of text mining experiment provides valuable information for the organization.

A Machine Learning Example For Business

This article gives you a practical example of predictive machine learning. This blog read is mainly targeted for business people who want to harness machine learning for business but also understand how it actually works. The aim is to demonstrate three things: tell a concrete example without going too deep in theory, show the difference between machine learning and reporting and demonstrate the benefits of machine learning to business.

Introduction

According to a definition machine learning means that a machine can learn without having explicitly programmed for the task. This doesn’t mean that the program code would evolve by itself, but different results are produces in different situations depending on the data and the set of rules that are applied.

For those who are interested in technical part, the R code and data is available at the end of the post.

Machine learning use cases

Let’s quickly see some machine learning use cases.

#1 Predicting by variables

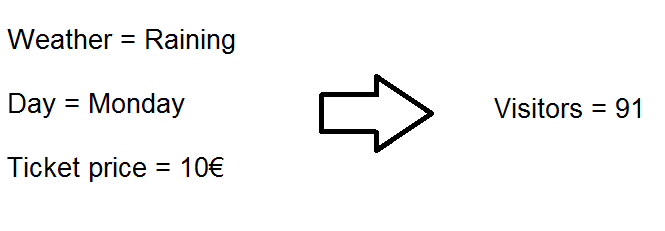
Problem. How to predict the number of visitors in an event?

Simple solution. Calculate the average from past events.

Machine learning solution. Take advantage of known event related variables when predicting number of visitors. These variables might be weather, day of week and ticket price. This makes the prediction more accurate than overall average.

Predicting by variables

#2 Clustering

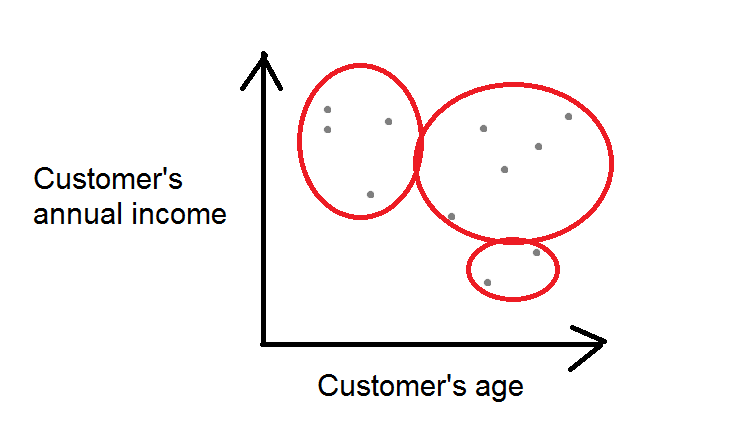
Problem. How to identify customer segments?

Simple solution. Make an educated guess by using fixed values.

Machine learning solution. The algorithm usually needs some initial parameters such as the number of clusters to identify. Segmentation process could be automated and standardized. The segmentation could be run once a day, week or month without any manual work. Another advantage is that there’s no need to set hard limits such as If customer’s annual income is more than 20 000€ and age more than 50, she’s in segment A. The algorithm will set these limits for you.

Machine learning clustering example

#3 Image recognition and classification

Problem. How to recognize objects, emotions or text from an image?

Simple solution. Do it manually.

Machine learning solution. The algorithm has to be “trained” with already known cases to recognize which kind of pixel and color combinations means certain object. Image recognition could be used to identify data tables from hand written documents to transform the data to digital format. You could also detect other kind of objects such as a human face and take the analysis further by recognizing person’s emotions.

Image recognition example

A business problem: Online store deliveries

In the more detailed example, I will go through similar case than the #1: The process of predicting by variables as it is very common scenario in business analytics. Also many of the concepts can be used even in image recognition once the image pixels has been converted to tabular data.

Let’s imagine that we are running an online shop that orders nutrition supplements from a wholesaler and sells the products to consumers.

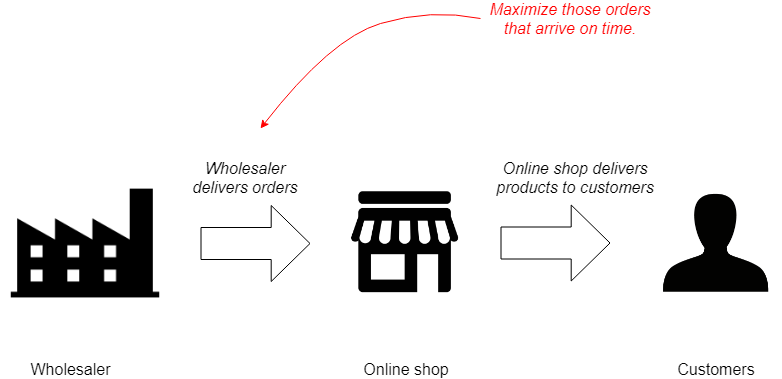
Machine learning on supply chain management

The online store wants to maximize those wholesale orders that will arrive on time. This will increase predictability and end user satisfaction, that will lead to bigger profits.

Sample data

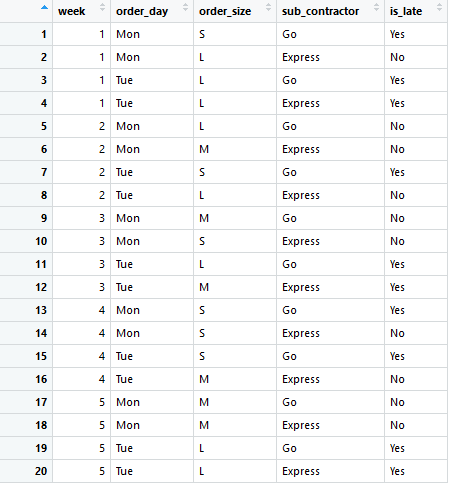
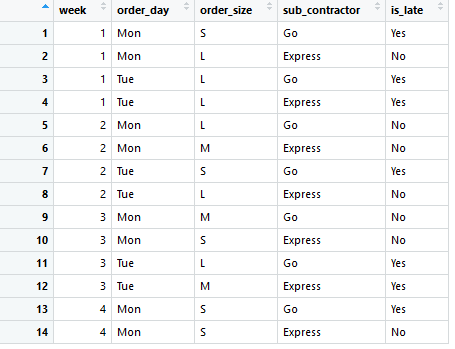
In the sample data a record corresponds to an order made for a wholesaler in the past. The first column is the week when the order has been made (week). Then there are the day of week (order_day), order batch size (order_size), sub contractor delivering the order (sub_contractor) and the info whether the delivery was late or not (is_late).

Sample data for machine learning

Usually collecting and cleaning the data is by far the most time consuming part. That has been already done in this example, so we can move to analysis. For example, maybe in the original data the size of order was the number of items, but for this case the variable has expressed in S (small), M (medium) or L (large).

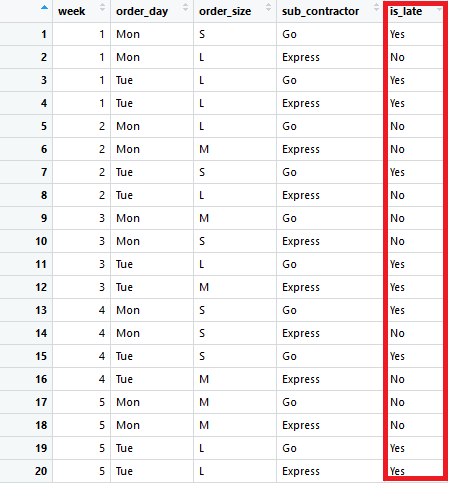
There are dozens of predictive machine learning algorithms that work in a different way, but a typical situation is to create a table like this, where the last column is the variable that you want to predict. For historical data the predicted variable is known already. All or part of the other variables are predictor variables.

Result variable in sample data

Predicting from reports is not systematic

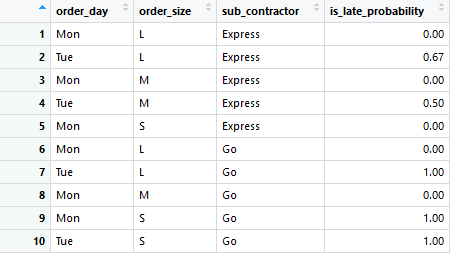
In traditional reporting you could analyze the rate of late arriving orders from previously introduced 20 rows of data by doing basic data aggregation and see how many percent of orders have arrived late on average for each variable combination.

Summary report

Using reports to forecast future is problematic, however. If there’s only one record for a combination such as Mon, L and Express in row 1, the probability is always 0 or 1, which can’t be true. The summary report also does not handle individual variables (columns) as independent entities, and that’s why there is no way of evaluating probability for previously non existing combinations such as Tue, M and Go.

And the most important part: There’s no way of evaluating how these insights fit into new wholesale orders.

Concept of training and testing in machine learning

The secret of predictive machine learning is to split the process in two phases:

  1. Training the model
  2. Testing the model

The purpose is, that after these two stages you should be confident whether your model works for the particular case or not.

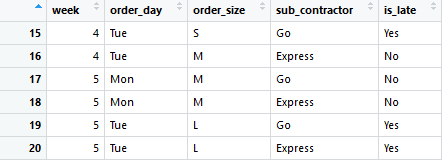
For testing and training, the data has to be split in two parts: Training data and testing data. Let’s use a rule of thumb and take 70% of rows for training and 30% for testing. Note, that all the data is historical and thus the actual outcome for all records are known.

First 14 rows (70%) are for model training.

Training data

In the training phase the selected algorithm produces a model. Depending on the selected method, the model could be for example:

  • An algorithm.
  • A formula such as 2x+y+3z-1.
  • A lookup table.
  • A decision tree.
  • Any other kind of data structure.

The important thing is, that the produced model should be something that you can use to make predictions in the testing phase. The situation is very fruitful, as now you can make a prediction for each record in testing data with the model, but you can also see, what was the actual outcome for that observation.

The trained model will be tested with the last 6 rows (30%). Testing data

Selecting the machine learning algorithm

Normally you would pre-select multiple algorithms and train a model with each of them. The best performing one could be chosen after the testing phase. For simplicity, I selected just one for this example.

The algorithm is called naive bayesian classifier. I will extract the complicated name to its components.

Naive. The algorithm is naive or “stupid” as it doesn’t take in to account interactions between variables such as order_day and sub_contractor.

Bayesian. A field of statistics named after Thomas Bayes. The expectation is that everything can be predicted from historical observations.

Classifier. The predicted variable is_late is a categorical and not a number.

The naive bayesian classifier algorithm will be used to predict is_late when predictor variables are know beforehand: order_day, order_size and sub_contractor. All variables are expected to be categorical for naive bayes, and that is why it suits to out needs well.

Naive bayes classifier is quite simple algorithm and gives the same result every time when using the same data. It would be possible to explain the logic behind each predictions. In some cases, this is a very valuable.

The week column won’t be used for prediction and its purpose will be explained at the end of the next chapter.

Training and testing the model

Without going too deep in the details, you can run something like this in statistical programming language such as R:

model <- naiveBayes(is_late~order_day+order_size+sub_contractor, data=data.train)

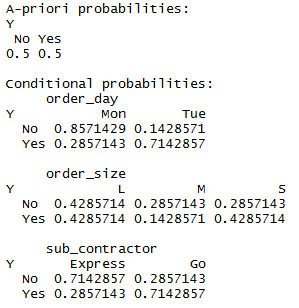
And this kind of data will be stored in computers memory:

Naive bayes model output in R

The point is not to learn inside out what these numbers mean, but to understand that this is the model and the software understands how to apply them to make predictions for new orders:

predictions <- predict(model, newdata=data.test)

By doing some copy and paste operations, the predictions can be appended to testing data:

Naive bayes predictions

If the value in Yes column is more than 0.5, it means that the prediction for that order is to arrive late.

In our case the order of records matter: The model should be trained with observations that have occurred before the observations in test data. The number of week (`week`) is a helper column to order the data for train and test splitting.

Evaluating the goodness of the model

A good way to evaluate the performance of the model in this example is to calculate how many predictions we got correct. The actual value can be seen from is_latecolumn and the prediction from Prediction column.

Because I had the power to create the data for this example, all 6 predictions were correct. For the second record the probability for both being late and not being late was 50%. If this would have been interpreted as Yes, the prediction would have been incorrect, and the accuracy would have fallen to 83.3% or 5/6.

Naive bayes prediction 50-50

Evaluating the business benefit

So far we have:

  1. Identified a business problem.
  2. Combined and cleaned possibly relevant data.
  3. Selected a suitable algorithm.
  4. Trained a model.
  5. Tested the model with historical data.
  6. Evaluated the prediction accuracy.

Now it’s time to evaluate the business benefit.

We are confident, that our model is between 83.3% to 100% accurate for unseen observations, where only order day, order size and sub contractor are known before setting up the order. Let’s trust the mid point and say that accuracy is 91.7%.

You can count that in test data 3/6 or 50% of orders arrived late. Supposing that you would have used your trained machine learning model, you could have made the order only for those 3 or 4 deliveries that are predicted to arrive on time and a couple of additional orders that are not described in the test data.

In real world the situation would be more complex, but you get the idea that accuracy of 91.7% is more than 50%. With these numbers you are probably also able to estimate the impact in terms of money.

Implementing the model to daily work

Here are some ways to harness the solution for business.

Data study. Improve company’s process by experimenting the optimal order types.

Calculator. Let employers enter the three predictor variables to a web calculator before placing the order to evaluate the risk of receiving products late.

Automated orders. Embed the calculation as part of the company’s IT infrastructure. The system can make the optimal orders automatically.

As time goes by, more historical orders can be used in training and testing. More data makes the model more reliable.

The model can be trained with the order data from past year once a day for example. Frequent training and limiting data only to latest observations doesn’t make machine literally learn, but rather this adjust the model to give the best guess for the given situation.

Summary

A predictive machine learning model offers a way to see the future with the expectation that the environment remains somewhat unchanged. The business decisions don’t need to be based on hunches and prediction methods can be evaluated systematically.

Thoughtfully chosen machine learning model is able to make optimal choices in routine tasks with much greater accuracy than humans. Machine learning makes it also possible to estimate the monetary impacts of decisions even before the actions has been taken.

Machine learning won’t replace traditional reporting nor it is in conflict with it. It is still valuable to know key performance indicators from past month or year.

Even though there are endless ways to do machine learning, predicting a single variable is a pretty safe place to start.

Data

week,order_day,order_size,sub_contractor,is_late
1,Mon,S,Go,Yes
1,Mon,L,Express,No
1,Tue,L,Go,Yes
1,Tue,L,Express,Yes
2,Mon,L,Go,No
2,Mon,M,Express,No
2,Tue,S,Go,Yes
2,Tue,L,Express,No
3,Mon,M,Go,No
3,Mon,S,Express,No
3,Tue,L,Go,Yes
3,Tue,M,Express,Yes
4,Mon,S,Go,Yes
4,Mon,S,Express,No
4,Tue,S,Go,Yes
4,Tue,M,Express,No
5,Mon,M,Go,No
5,Mon,M,Express,No
5,Tue,L,Go,Yes
5,Tue,L,Express,Yes

R Code

library(e1071)
library(plyr)
library(dplyr)

f.path <- 'C:/Users/user/folder/data.csv'
df <- read.csv(f.path, sep=",")
df

#Make a summery table
df.sum <- df
df.sum$is_late <- ifelse(df.sum$is_late=="Yes",1,0)
agg <- aggregate(df.sum[,'is_late'], list(df.sum$order_day, df.sum$order_size, df.sum$sub_contractor), mean)
names(agg) <- c("order_day","order_size","sub_contractor","is_late_probability")
agg$is_late_probability <- round(agg$is_late_probability,2)
agg

#Split to train and test data
data.train <- df[1:14, ]
data.train
data.test <- df[15:20, ]
data.test

#Count data by order size
table(data.train[1:14, 'order_day'], data.train[1:14, 'is_late'])
table(data.train[1:14, 'order_size'], data.train[1:14, 'is_late'])
table(data.train[1:14, 'sub_contractor'], data.train[1:14, 'is_late'])

#Fit naive bayes model
fit <- naiveBayes(is_late~order_day+order_size+sub_contractor, data=data.train)
fit

#Predict probabilites
probs <- predict(fit, data.test, type = "raw")
probs <- data.frame(probs)
probs

#Get more probable option
Prediction <- ifelse(probs$Yes>0.5,"Yes","No")

#Paste predicted probabilities to original data
data.test.new <- cbind(data.test, probs, Prediction)

#Prediction rate
sum(data.test.new$Prediction == data.test.new$is_late) / nrow(data.test.new)