Tableau goes Minority Report in TC23 – takes direction towards augmented reality, generative AI and headless BI

Tableau Conference (TC23) was held last week in Las Vegas and once again it shed light on Tableau’s long term roadmap but also provided some concrete examples of features coming in the next releases. Tableau jumped on the generative AI bandwagon with Tableau GPT. Tableau Pulse redefines metrics and creates a new landing page for data consumption. VizQL Data Service is the first step towards headless BI for Tableau. The introduction of Tableau Gestures in an augmented reality context was impressive, it reminded me a bit of Tom Cruise exploring data in the film Minority Report.

TC23 keynote was started by Chief Product Officer Francois Ajenstat with the celebration of Tableau’s 20 years long journey. Francois emphasised the role of Tableau and Tableau community as a key innovator in easy-to-use self-service analytics. ”A new day for data” was used as a title for the upcoming introductions to suggest there is something big and impressive coming out.

The new CEO of Tableau, Ryan Aytay, also thanked the community, customers, partners and employees for their support. Ryan revealed Tableau success plan for all customers coming later this year to listen and support customers more closely. One of the conference highlights was once again Iron Viz visualisation competition, this year’s winner was Paul Ross with his magnificent renewable energy dashboard.

Tableau Conference venue during Iron Viz competition with the winner Paul Ross
Tableau Iron Viz vibes in TC23 (photo credit Sharad Adhikari).

But what about the features? Tableau GPT is a very interesting new feature but in a way it isn’t very unique considering almost every organisation is talking about language models and generative AI. On the other hand, it doesn’t mean the feature wouldn’t be very useful, it might be quite the opposite. Tableau Pulse might be a bigger thing than you first think. It has a very appealing UI to combine metrics, visualisations, descriptive information and Tableau GPT based additional insights & interactions. The redesigned metrics layer seems to be much more flexible than before. Metrics are easier to create, more powerful and they can be used around Tableau: in Pulse, dashboards, emails, Slack and mobile.

Possibly a bit more surprising feature is the upcoming VizQL Data Service that takes Tableau towards composable analytics or headless BI. This means you can connect directly to the Tableau backend data model (hyper engine) to query the data without the need of building frontend visualisations with Tableau. This would provide a lot more flexibility when creating data-related products and solutions where you need to use data & analytics. This feature might be somewhat related to the fact that Salesforce is using Tableau hyper data models within its Data Cloud offering to boost analytics possibilities. In the future, Salesforce could use data accelerated by Tableau data engine in their Salesforce Clouds via VizQL Data Service.

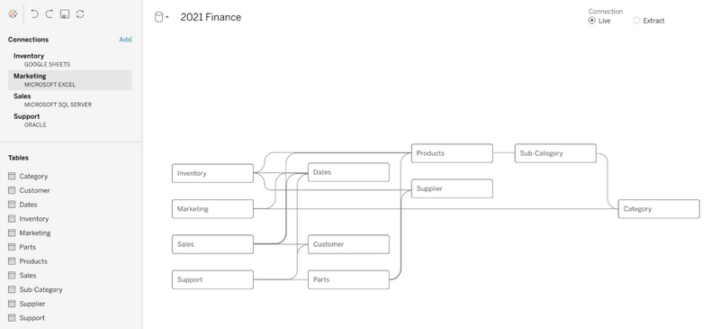
From an analytics developer point of view, the most interesting single feature showcased in TC23 (originally introduced in TC22) was shared dimensions (or multi-fact models) support. Shared dimensions enable more flexible multi-fact data models where multiple fact tables can relate to shared dimension tables. This feature makes the logical data layer introduced a couple of years ago more comprehensive and very powerful. Tableau would finally fully support the creation of enterprise level data models that can be leveraged in very flexible ways and managed in a centralised manner. The user interface icon for defining the relationships looked a bit like a meatball, and because the relationships in the logical data model have been referred to as noodles, it was said that Tableau is bringing meatballs to the noodles, very clever 🙂. 

Perhaps the coolest little thing was the augmented reality demo where Matthew Miller used a gesture-based user interface to interact with data and visualise it in a meeting context. The demonstration had a bit of a Minority Report vibe in it, perhaps the technology wasn’t yet as smooth as in the film, but Miller was just as convincing as Tom. Tableau gestures feature was created by the Tableau research team and it appears to be in its early stages. Most likely it won’t be released any time soon, but it might be a hint of where data interaction is going in the future.
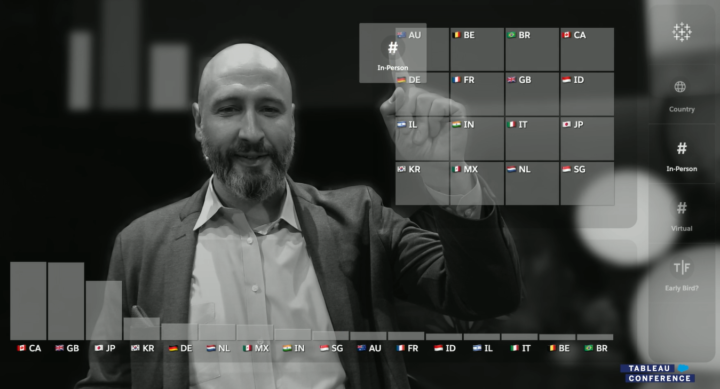
Matthew Miller using hand gestures to analyse data
Matthew Miller demonstrates gesture-based data analytics in TC23.

But what wasn’t mentioned in the TC23? There are a couple of features or big announcements that were highlights in TC21 and TC22, but haven’t yet been released and weren’t mentioned again in TC23. One year ago, in TC22, one of the big buzzwords was business science. It was described as business-driven data science using autoML features and scenario planning etc. But in TC23 keynote business science wasn’t mentioned at all nor were the Model builder or Scenario Planner features.

Next, I’ll go through the key features introduced in TC23 and also list functionalities presented in TC22 and TC21 to understand the big picture. These feature lists don’t contain all the features included in previous releases but the ones mentioned in earlier Tableau Conferences. More info about TC22 and TC21 introduced features can be found in our previous blog posts:

Note: All the product/feature related images are created using screenshots from the TC23 Opening Keynote / Devs on Stage session. You can watch the sessions at any time on Tableau site.

Workbook authoring & data visualisation

Let’s start with workbook authoring and actual data visualisation related features. The only new feature was the new Sankey and Radial charts (or mark types) that are already in pilot use in Tableau Public. It was suggested that there are also other new chart types to be released in near future. Even though I’m a bit sceptical towards too complex or hyped visualisations it’s good to have the option to easily create something a bit different. Because of Tableau’s flexibility, creating something totally crazy has always been possible but often it has required a lot of data wrangling and custom calculations. 
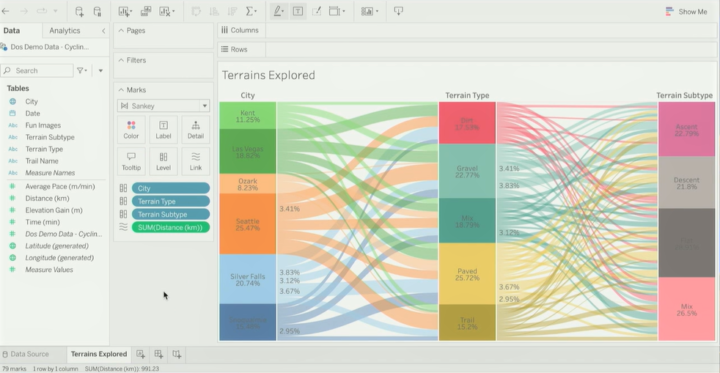
Sankey visualisation in Tableau Desktop
Out-of-the-box Sankey chart type presented in TC23.

Creating custom visualisations with Visualisation Extensions was introduced in TC21 (more info here), but we haven’t heard anything about this feature since. It might be that the visualisation extensions development has been stopped or paused, but still these new Sankey and Radial chart types might have something to do with the visualisation extension development done in the past, who knows?

  • New in TC23
    • TC23 New mark types (pilot period currently in Tableau Public): Create Sankey & radial charts using specific mark types. Possibly new native mark/charts types in the future.
    • TC23 Improved Image role functionality: new file types (gif) & expansion to the size limit.
    • TC23 Edit alt text (for screen readers) directly in Data Guide
  • Previously introduced and already released features
    • TC22 Image role (2022.4): Dynamically render images in the viz based on a link field in the data.
    • TC21 Dynamic zone visibility (2022.3): Use parameters & field values to show/hide layout containers and visualisations.
    • TC21 Redesigned View Data (2022.1): View/hide columns, reorder columns, sort data, etc.
    • TC21 Workbook Optimizer (2022.1): Suggest performance improvements when publishing a workbook.
    • TC21 Multi Data Source Spatial Layers (2021.4): Use data from different data sources in different layers of a single map visualisation.
  • Previously introduced but not released nor mentioned in TC23
    • TC21 Visualisation Extensions (~2022 H2): Custom mark types, mark designer to fine-tune the visualisation details, share custom viz types.

Consume analytics & understand data

The hype (and also actual new features) around generative AI have been the number one topic for most of the tech companies this year, and it sure was also for Tableau. Tableau introduced Tableau GPT, which is a generative language model integrated to Tableau and its data with security and governance included. Tableau GPT can be useful for both consumers and analysts. It can be used to search data and find insights just by writing questions and it’ll provide answers in both written text and as a visualisation (like Ask data with steroids). Ask any question and Tableau GPT will help to 1) Find relevant data sources, 2) Analyse data, 3) Present results in text and chart with the possibility to explore more, 4) Suggest related additional questions. It was suggested that Tableau GPT will also be integrated into Data Guide and for developers/analysts to the calculation editor to help build calculations.

Tableau Pulse was another big announcement. It’s a completely new interface to consume analytics and insights with the ability to ask questions via Tableau GPT. It seems to be mostly intended for consumers to follow and understand key metrics and related trends, outliers and other interesting aspects. Tableau Pulse includes a redesigned metrics layer with the possibility to create embeddable metrics manually or suggested by Tableau GPT. It contains personalised metrics & contents (changes, outliers, trends, drivers) and descriptive information created by Tableau GPT.
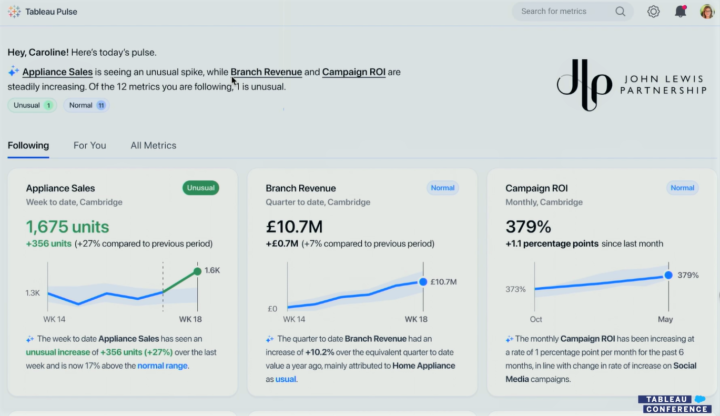
Tableau Pulse user interface with metrics information
Tableau Pulse with metrics and TableauGPT generated textual contents presented in TC23.

Unfortunately, we still need to wait to get our hands on Tableau GPT and Tableau Pulse. It might be the end half of this year or even early next year when Tableau actually gets these new features released.

  • New in TC23
    • TC23 Tableau GPT (~pilot 2023 H2): Generative AI to assist in searching, consuming and developing data & analytics in many Tableau user interfaces.
    • TC23 Tableau Pulse with redesigned metrics (~pilot 2023 H2): New user interface to consume analytics and create, embed & follow metrics.
    • TC23 Tableau Gestures & augmented analytics: Use gestures to interact with data and infuse analytics into meetings. 
  • Previously introduced and already released features
    • TC22 Data Guide (2022.3): Contains information about the dashboard and fields, applied filters, data outliers and data summary, and links to external resources.
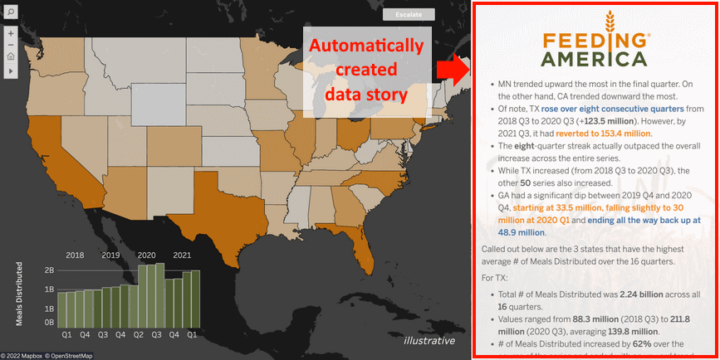
    • TC22 Data Stories (2022.2 & 2022.3):  Dynamic and automated data story component in Tableau Dashboard. Automatically describes data contents.
    • TC21 Data Change Radar (2022.3): Alert and show details about meaningful data changes, detect new outliers or anomalies, alert and explain these.
    • TC21 Explain the Viz (2022.3): Show outliers and anomalies in the data, explain changes, explain marks etc.
    • TC21 Multiple Smaller Improvements in Ask Data (2022.2 & 2022.3): Contact Lens author, Personal pinning, Lens lineage in Catalog, Embed Ask Data.
    • TC21 Ask Data improvements (2022.1): Phrase builder already available, phrase recommendations available later this year.
  • Previously introduced but not released nor mentioned in TC23
    • TC21 Model Builder: Use autoML to build and deploy predictive models within Tableau. Based on Salesforce’s Einstein platform.
    • TC21 Scenario Planner: Easy what-if-analysis. View how changes in certain variables affect target variables and how certain targets could be achieved.

Collaborate, embed and act

New features in this area related heavily to embedding and using Tableau data for building external data products and services. Especially the VizQL Data Service is Tableau’s first step towards composable analytics where the backend data layer and frontend user interface don’t need to be created with the same tool or technology. Composable analytics or headless BI is seen as a future trend in analytics. VizQL Data Service provides access to data modelling capabilities and data within Tableau to streamline building different kinds of data products with Tableau data. This means that data from Tableau could easily be used outside Tableau without actually embedding visuals, but using the data itself in different ways.

Another introduced feature was the Embedding Playground that will ease up the creation of code to embed Tableau visuals and different kinds of interactions. In the playground, you can select options from dropdowns to alter embedding settings, create interactions (eg. context menus, export, filtering, marks etc.) and get ready to be embedded in Javascript & HTML code. Ephemeral users will centralise user identity and access management and in the future usage-based licensing will be provided to make the pricing more flexible to.

  • New in TC23
    • TC23 Tableau Embedding Playground (dev preview now): Configure embedding options without coding.
    • TC23 Ephemeral users (~2023 H2): Centralises user identity and access management to one place. Usage-based licensing options in the future.
    • TC23 VizQL Data Service (~dev preview 2023 H2): Tableau’s first step is to decouple the data and presentation layer.
    • TC23 Grant access to a workbook when sharing
  • Previously introduced and already released features
    • TC22 Tableau External Actions (2022.4): Trigger actions outside Tableau, for example, Salesforce Flow actions. Support for other workflow engines will be added later.
    • TC22 Publicly share dashboards: Share content via external public facing site to give access to unauthenticated non-licenced users, only Tableau Cloud. Available via Tableau Embedded analytics usage-based licensing.
    • TC21 Embeddable Ask Data (2023.1)
    • TC21 Embeddable Web Authoring (2022.2): No need for a desktop when creating & editing embedded contents, full embedded visual analytics.
    • TC21 3rd party Identity & Access Providers (2022.2): Better capabilities to manage users externally outside Tableau.
    • TC21 Connected Apps (2021.4): More easily embed to external apps, creating a secure handshake between Tableau and other apps.
    • TC21 Tableau search, Explain Data and Ask Data in Slack (2021.4)
    • TC21 Tableau Prep notifications in Slack (2022.1)

Data preparation, modeling and management

My personal favourite, the Shared dimensions feature, which was introduced already a year ago, was demoed once again. It enables more flexible multi-fact data models with shared dimension tables to create more flexible and comprehensive data models. At least the modelling UI seemed to be rather ready, but unfortunately we didn’t get a target schedule for when this might be released.
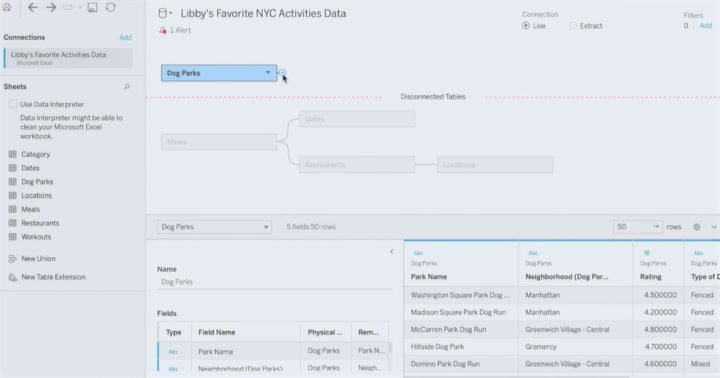
Modeling interface with shared dimension in Tableau Desktop
Shared dimensions enable multi-fact data sources. Example presented in TC23.

One very welcome little feature is Address Geocoding which allows you to visualise addresses on a map without doing the geocoding beforehand. Related to data models, Tableau also emphasised how Tableau data models are used and available within Salesforce Data Cloud (Tableau Hyper-accelerated queries) and also in the future Data Cloud contents can be analysed in Tableau with a single click (Tableau Instant Analytics in SF Data Cloud).

  • New in TC23
    • TC23 Tableau Hyper-accelerated queries in SF Data Cloud (Available now): Salesforce data Cloud is at least partially based on Tableau Hyper data models, which can be used to easily analyse the data within Salesforce Data Cloud without additional modeling steps.
    • TC23 Tableau Instant Analytics in SF Data Cloud (~2023 H2): Analyse SF Data Cloud data with Tableau with one click.
    • TC23 Address Geocoding: geocode address data in Tableau to visualise addresses on a map.
    • TC23 Use TableauGTP in prep & modeling: ask TableauGTP to create advanced calculations, eg. extract email address from json.
    • TC23 Tableau Prep enhancements: spatial joins, smart suggestion to remove duplicates & easily set header and start a row.
  • Previously introduced and revisited in TC23
    • TC22 Shared dimensions / multi-fact models: Build multi-fact data models where different facts relate to multiple shared dimensions.
    • TC22 New AWS data sources: Amazon S3 connector. Previously mentioned also Amazon DocumentDB, Amazon OpenSearch, Amazon Neptune.
    • TC22 Multi-row calculations in Prep: Calculate for example running total or moving average in Tableau Prep.
  • Previously introduced and already released features
    • TC22 Insert row number and clean null values in Prep (2023.1): Easily insert row number column and clean & fill null values.
    • TC22 Table extensions (2022.3): Leverage python and R scripts in the data model layer.
    • TC22 Web data connector 3.0 (2022.3): Easily connect to web data and APIs, for example to AWS S3, Twitter etc.
    • TC21 Data Catalog Integration: Sync external metadata to Tableau.
    • TC21 Virtual Connections (2021.4): Centrally managed and reusable access points to source data with a single point to define security policy and data standards.
    • TC21 Centralised row-level security (2021.4): Centralised RLS and data management for virtual connections.
    • TC21 Parameters in Tableau Prep (2021.4): Leverage parameters in Tableau Prep workflows.
  • Previously introduced but not released nor mentioned in TC23
    • TC21 Tableau Prep Extensions: Leverage and build an extension for Tableau Prep (sentiment analysis, OCR, geocoding, feature engineering etc.).

Tableau Cloud management

For Tableau Cloud management Tableau emphasised HIPAA compliance and improved activity logs to analyse for example login activities and attempts. Customer-managed IP filtering for Tableau Cloud will streamline cloud security management. There were also new features introduced related to access token management in the Tableau Cloud environment.

  • New in TC23
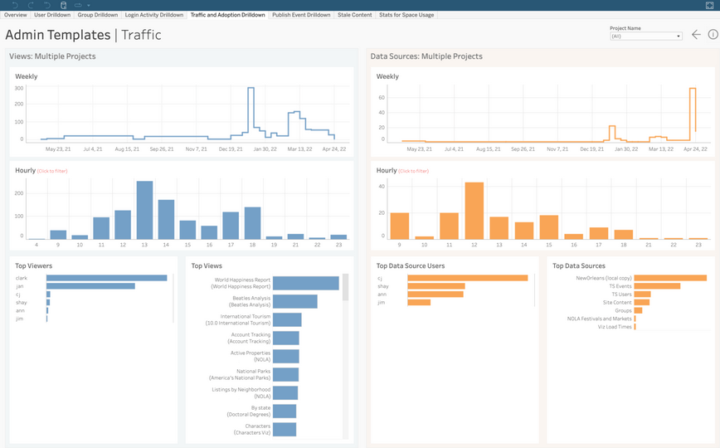
    • TC23 Improved activity logs: More data in admin templates about login activities & attempts.
    • TC23 Customer-managed IP filtering: Set IP address filtering to limit access to Tableau Cloud Site.
    • TC23 Enhanced access token management: Access token management via API, Control personal access token creation via user group and set expiration periods.
  • Previously introduced and revisited in TC23
    • TC22 Multi-site management for Tableau Cloud: Manage centrally all Tableau Cloud sites.
  • Previously introduced and already released features
    • TC22 Customer-managed encryption keys (2022.1): BYOK (Bring Your Own Keys). 
    • TC22 Activity Log (2022.1): More insights on how people are using Tableau, permission auditing etc.
    • TC22 Admin Insights (2022.1): Maximise performance, boost adoption, and manage content.
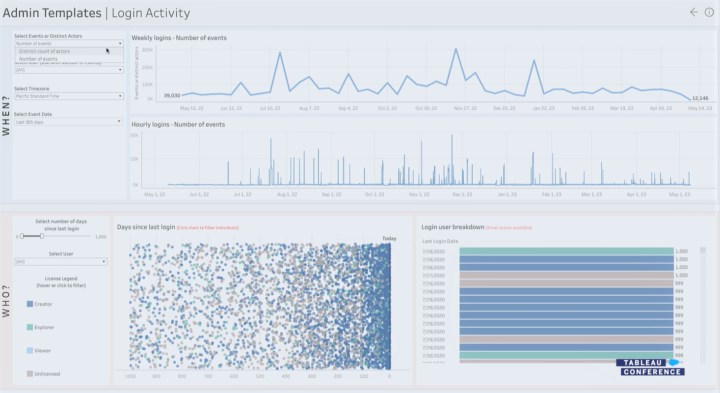
Admin Templates login activity dashboard
Tableau Admin Insights login activity example presented in TC23.

Tableau Server management

Again this year, there weren’t too many new specific features related to Tableau Server management. On the other hand, it was emphasised that the possibility to use an on-premise Tableau Server will be an option also in the future.

  • Previously introduced and already released features
    • TC22 Auto-scaling for Tableau Server (2022.3): Starting with backgrounder auto-scaling for container deployments.
    • TC21 Resource Monitoring Improvements (2022.1): Show view load requests, establish new baseline etc.
    • TC21 Backgrounder resource limits (2022.1): Set limits for backgrounder resource consumption.
    • TC21 Time Stamped log Zips (2021.4)

Tableau Ecosystem & Tableau Public

Tableau Public had a few new features introduced, like improved search. Accelerators weren’t mentioned too much in TC23, but lately their usability has improved with the ability to easily map fields when taking dashboard accelerators in use. There were some Tableau Public-related features introduced few years ago in TC21 that haven’t been released yet. Especially getting more connectors to Tableau Public would be very nice, and also the possibility to publish Prep workflows to Tableau Public would be great. Let’s see if we get these previously introduced features to use in the future.

  • New in TC23
    • TC23 Tableau Public Enhanced search with sorting & filtering, network activity feed with notifications & extra info, profile pronouns
  • Previously introduced and already released features
    • TC21 Tableau Public Custom Channels:  Custom channels around certain topics.
    • TC21 Tableau Exchange: Search and leverage shared extensions, connectors, more than 100 accelerators. The possibility to share the dataset may be added later on.
    • TC21 Accelerators: Dashboard starters for certain use cases and source data (e.g. call center analysis, Marketo data, Salesforce data etc.). Can soon be used directly from Tableau.
  • Previously introduced but not released nor mentioned in TC23
    • TC21 Tableau Public Slack Integration (~2022 H1)
    • TC21 More connectors to Tableau Public (~2022 H1): Box, Dropbox, OneDrive.
    • TC21 Publish Prep flows to Tableau Public: Will there be a Public version for Tableau Prep?

Want to know more?

If you are looking for more info about Tableau, please read our previous blog posts, check out our visualisation and Tableau offering, and send a message to discuss more (via our website):

More info about the upcoming features on the Tableau coming soon page.
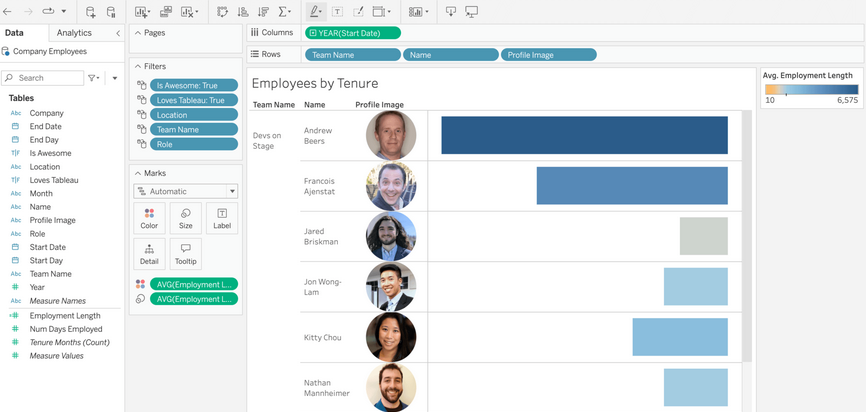
Tableau Image Role Example

Overview of the Tableau product roadmap based on TC22 and TC21

Tableau Conference (TC22) was held last week in person in Las Vegas (with virtual participation possibility). Majority of the introduced new features and functionalities were related to data preparation & modeling, easy and automated data science (business science as Tableau calls it), and Tableau Cloud management & governance capabilities. Tableau is on its journey from a visual analytics platform to a full scale end-to-end analytics platform.

In the keynote Tableau CEO Mark Nelson emphasised the role of both Tableau and Salesforce user communities to drive change with data: there are over 1M Tableau Datafam members and over 16M Salesforce Trailblazers. Once again, the importance of data for businesses and organisations was highlighted. But the viewpoint was data skills – or lack of them – and data cultures more than technologies. Mark Nelson underlined the meaning of cloud saying 70% of new customers start their analytical journey in the cloud. One of the big announcements was rebranding Tableau Online to Tableau Cloud and introducing plenty of new features to it.

Taking account the new features introduced at TC22 Tableau platform includes good data preparation and modelling capabilities with many connectors to a variety of data sources, services and APIs. Tableau’s visual analytics and dashboarding capabilities are already one of best in the market. In TC21 last year Tableau talked a lot about Slack integration and embedding to boost collaboration and sharing of insights. At the moment, effort is put especially to democratize data analytics for everyone despite gaps in the data skills. This is done using autoML type of functionalities to automatically describe and explain data, show outliers, create predictions and help to build and act on scenarios. Also the cloud offering with better governance, security and manageability was a high priority.

Next I’ll go through the key features introduced in TC22 and also list functionalities presented in TC21 to understand the big picture. More info about TC21 released features can be found in a previous blog post: A complete list of new features introduced at the Tableau Conference 2021. These feature lists don’t contain all the features included in previous releases but the ones mentioned in TC21.

Note: All the images are created using screenshots from the TC22 Opening Keynote / Devs on Stage session and Tableau new product innovations blog post. You can watch the sessions at any time on Tableau site.

Update: Read latest TC23 blog Tableau goes Minority Report in TC23 – takes direction towards augmented reality, generative AI and headless BI.

Workbook authoring & data visualization

In TC22 there weren’t too many features related to workbook authoring. The only bigger announcement was the new image role to enable dynamic images in visualizations. These could be for example product images or any other images that can be found via a url link in the source data.  From TC21 there are still a couple of very interesting features waiting to be released, I’m especially waiting for dynamic dashboard layouts.

  • Introduced in TC22
    • Image role: Dynamically render images in the viz based on a link field in the data.
  • Introduced in TC21 (but not yet released)
    • Dynamic Dashboard Layouts (~2022 H1): Use parameters & field values to show/hide layout containers and visualizations.
    • Visualization Extensions (~2022 H2): Custom mark types, mark designer to fine tune the visualization details, share custom viz types.
  • Introduced in TC21 (and already released)
    • Multi Data Source Spatial Layers (2021.4): Use data from different data sources in different layers of a single map visualization.
    • Redesigned View Data (2022.1): View/hide columns, reorder columns, sort data, etc.
    • Workbook Optimizer (2022.1): Suggest performance improvements when publishing a workbook.
Tableau Image Role Example
Image role example to dynamically render images presented in TC22. Side note: have to appreciate the “Loves Tableau: True” filter.

Augmented analytics & understand data

For this area there were a couple of brand new announcements and more info about a few major functionalities already unveiled in TC21. Data stories is an automated feature to create descriptive stories about data insights in a single visualization. Data stories explains what data and insights is presented in the visualization, explanation changes dynamically when data is filtered or selected in the viz. With the data orientation pane the author can partly automate the documentation of dashboard and visualizations. It shows information about data fields, applied filters, data outliers and data summary, and possible links to external documentation.

Tableau Data Stories example
Example of automatically created descriptive data story within a dashboard presented in TC22.


Few originally in TC21 introduced features were also mentioned in TC22. Model Builder is a big step toward guided data science. It will help to build ML-model driven predictions fully integrated within Tableau. It’s based on the same technology as Salesforce’s Einstein Analytics. Scenario planner is a functionality to build what-if-analyses to understand different options and outcomes of different decisions.

  • Introduced in TC22
    • Data Stories (beta in Tableau Cloud):  Dynamic and automated data story component in Tableau Dashboard. Automatically describes data contents.
    • Data orientation pane: Contain information about dashboard and fields, applied filters, data outliers and data summary, and links to external resources.
    • Model Builder: Use autoML to build and deploy predictive models within Tableau. Based on Salesforce’s Einstein platform.
    • Scenario Planner: Easy what-if-analysis. View how changes in certain variables affect target variables and how certain targets could be achieved.
  • Introduced in TC21 (but not yet released)
    • Data Change Radar (~2022 H1): Alert and show details about meaningful data changes, detect new outliers or anomalies, alert and explain these.
    • Multiple Smaller Improvements in Ask Data (~2022 H1): Contact Lens author, Personal pinning, Lens lineage in Catalog, Embed Ask Data.
    • Explain the Viz (~2022 H2): Show outliers and anomalies in the data, explain changes, explain mark etc.
  • Introduced in TC21 (and already released)
    • Ask Data improvements (2022.1): Phrase builder already available, phrase recommendations available later this year.

Collaborate, embed and act

In TC21 collaboration and Slack integration were one of the big development areas. In TC22 there wasn’t much new about this topic, but Tableau actions were again demonstrated as a way to build actionable dashboards. Also the possibility to share dashboards publicly for unauthenticated non-licenced users was shown again in TC22. This functionality is coming to Tableau Cloud later this year.

  • Introduced in TC22
    • Tableau Actions: Trigger actions outside Tableau, for example Salesforce Flow actions. Support for other workflow engines will be added later.
    • Publicly share dashboards (~2022 H2): Share content via external public facing site to give access to unauthenticated non-licenced users, only Tableau Cloud.
  • Introduced in TC21 (but not yet released)
    • 3rd party Identity & Access Providers: Better capabilities to manage users externally outside Tableau.
    • Embeddable Web Authoring: No need for desktop when creating & editing embedded contents, full embedded visual analytics.
    • Embeddable Ask Data 
  • Introduced in TC21 (and already released)
    • Connected Apps (2021.4): More easily embed to external apps, create secure handshake between Tableau and other apps.
    • Tableau search, Explain Data and Ask Data in Slack (2021.4)
    • Tableau Prep notifications in Slack (2022.1)

Data preparation, modeling and management

My personal favourite of the new features can be found here. Shared dimensions enable more flexible multi-fact data models where multiple fact tables can relate to shared dimension tables. This feature makes the logical data model layer introduced a couple of years ago more comprehensive and very powerful. Tableau finally supports creation of enterprise level data models that can be leveraged in very flexible ways and managed in a centralized manner. Another data model related new feature was Table extensions that enable use of Python and R scripts directly in the data model layer.

Tableau Shared Dimensions Example
Shared dimensions enabled multi-fact data source example presented in TC22.


There are also features to boost data source connectivity. Web Data Connector 3.0 makes it easier to connect different web data sources, services and API’s. One important new data source is AWS S3 that will enable connection directly to the data lake layer. Also Tableau Prep is getting few new functionalities. Row number column and null value cleaning are rather small features. Multi-row calculations instead are a bit bigger thing, although the examples Tableau mentioned (running totals and moving averages) might not very relevant in data prep cause these usually must take into account filters and row level security and therefore these calculations must often be done at runtime.

  • Introduced in TC22
    • Shared dimensions: Build multi-fact data models where facts relate to many shared dimensions,
    • Web data connector 3.0: Easily connect to web data and APIs, for example to AWS S3, Twitter etc.
    • Table extensions: Leverage python and R scripts in the data model layer.
    • Insert row number and clean null values in Prep: Easily insert row number column and clean & fill null values.
    • Multi-row calculations in Prep: Calculate for example running total or moving average in Tableau Prep.
    • New AWS data sources: Amazon S3, Amazon DocumentDB, Amazon OpenSearch, Amazon Neptune.
  • Introduced in TC21 (but not yet released)
    • Data Catalog Integration: Sync external metadata to Tableau (from Collibra, Alation, & Informatica).
    • Tableau Prep Extensions: Leverage and build extension for Tableau Prep (sentiment analysis, OCR, geocoding, feature engineering etc.).
  • Introduced in TC21 (and already released)
    • Virtual Connections (2021.4): Centrally managed and reusable access points to source data with single point to define security policy and data standards.
    • Centralized row level security (2021.4): Centralized RLS and data management for virtual connections.
    • Parameters in Tableau Prep (2021.4): Leverage parameters in Tableau Prep workflows.

Tableau Cloud management

Rebranding Tableau Online to Tableau Cloud and a bunch of new management and governance features in it was one important area of TC22. Tableau Cloud can now be managed as a whole with multi-site management. Security has already been a key area when moving to cloud and now Tableau finally supports customer managed encryption keys (BYOK).  From a monitoring point of view both activity log and admin insights provide information how Tableau Cloud and contents in it are used.

  • Introduced in TC22
    • Multi-site management for Tableau Cloud: Manage centrally all Tableau Cloud sites.
    • Customer managed encryption keys (later 2022): BYOK (Bring Your Own Keys). 
    • Activity Log: More insights on how people are using Tableau, permission auditing etc.
    • Admin Insights: Maximise performance, boost adoption, and manage contents.
Tableau Admin Insights Example
Tableau Cloud Admin Insights example presented in TC22.

Tableau Server management

There weren’t too many new features in Tableau Server management, I guess partly because of the effort put into Tableau Cloud Management instead. However, Tableau Server auto-scaling was mentioned again and it will be coming soon starting with backgrounder auto-scaling.

  • Introduced in TC22
    • Auto-scaling for Tableau Server (2022 H1): Starting with backgrounder auto-scaling for container deployments.
  • Introduced in TC21 (but not yet released)
    • Resource Monitoring Improvements (~2022 H1): Show view load requests, establish new baseline etc.
    • Backgrounder resource limits (~2022 H1): Set limits for backgrounder resource consumption.
  • Introduced in TC21 (and already released)
    • Time Stamped log Zips (2021.4)

Tableau ecosystem & Tableau Public

Last year in the TC21 Tableau ecosystem and upcoming Tableau Public features had a big role. This year there wasn’t much new in this area but still the Tableau exchange and accelerators were mentioned and shown in the demos a couple of times.

  • Introduced in TC21 (but not yet released)
    • Tableau Public Slack Integration (~2022 H1)
    • More connectors to Tableau Public (~2022 H1): Box, Dropbox, OneDrive.
    • Publish Prep flows to Tableau Public: Will there be a Public version for Tableau Prep?
    • Tableau Public custom Channels (~2022 H1):  Custom channels around certain topics.
  • Introduced in TC21 (and already released)
    • Tableau exchange: Search and leverage shared extensions, connectors, more than 100 accelerators. Possibility to share dataset may be added later on.
    • Accelerators: Dashboard starters for certain use cases and source data (e.g. call center analysis, Marketo data, Salesforce data etc.). Can soon be used directly from Tableau.

Want to know more?

If you are looking for more info about Tableau read our previous blog posts:

More info about the upcoming features on the Tableau coming soon page.
Check out our offering about visual analytics & Tableau, and book a demo to find out more:


A complete list of new features introduced at the Tableau Conference 2021

The Tableau Conference 2021 is over and yet again it was a lot of fun with all the not-so-serious music performances, great informative sessions, excellent Iron Viz competition, and of course demonstrations of many new features coming in the future releases. In general my first thoughts about the new capabilities revealed in TC21 are very positive. Obviously some of the details are still a bit blurry but the overall topics seem to be in a good balance: There are very interesting improvements coming for visual analytics, data management and content consumption in different channels, but in my opinion the most interesting area was augmented analytics and capabilities for citizen data scientists.

It’s been 2 years since Salesforce announced the acquisition of Tableau. After acquisitions and mergers, it’s always interesting to see how it affects the product roadmap and development. Now I really feel the pace for Tableau is getting faster and also the scope is getting more extensive. Tableau is not only fine tuning the current offering, but creating a more comprehensive analytics platform with autoML, easier collaboration & embedding, and action triggers that extend beyond the Tableau.

Note: All the pictures are created using screenshots from the TC21 Devs on Stage and TC21 Opening Keynote sessions. You can watch the sessions at any time on Tableau site.

Update: Read our latest overview of the Tableau product roadmap based on TC22 and TC21 and Tableau goes Minority Report in TC23 – takes direction towards augmented reality, generative AI and headless BI blog posts.

The Basics – Workbook Authoring

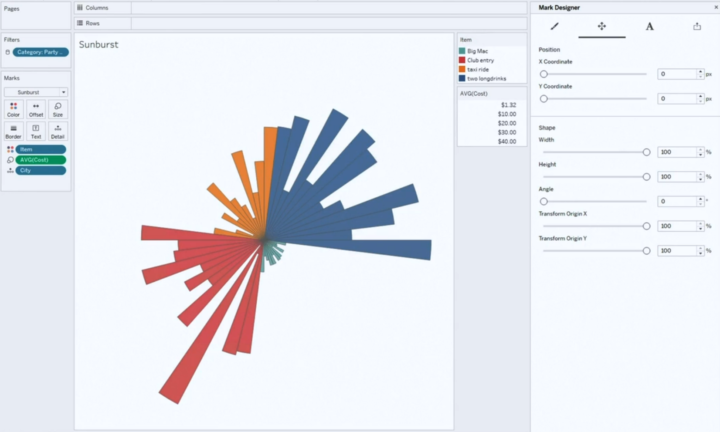
Let’s dive into workbook authoring first. It is still the core of Tableau and I’m very pleased to see there is still room for improvement. For the workbook authoring the biggest announcement was the visualization extensions. This means you can more easily develop and use new custom visualization types (for example sunburst and flower). The feature makes it possible to adjust visualization details with mark designer and to share these custom visualizations with others. Another very nice feature was dynamic dashboard layouts, you can use parameters and field values to dynamically toggle the visibility of dashboard components (visualizations and containers). This gives so much more power to flexibly show and hide visualizations on the dashboard.

There is also a redesigned UI to view underlying data with options to select the desired columns, reorder columns and sort data, export data etc. For map analysis the possibility to use data from multiple data sources in spatial layers is a very nice feature. Using workbook optimizer you can view tips to improve performance when publishing the workbook. In general it also seems the full web authoring for both data source and visualization authoring isn’t very far away anymore.

  • Visualization Extensions (2022 H2): Custom mark types, mark designer to fine tune the visualization details, share custom viz types.
  • Dynamic Dashboard Layouts (2022 H1): Use parameters & field values to show/hide layout containers and visualizations.
  • Multi Data Source Spatial Layers (2021.4): Use data from different data sources in different layers of a single map visualization.
  • Redesigned View Data (2022 H1): View/hide columns, reorder columns, sort data, etc.
  • Workbook Optimizer (2021.4): Suggest performance improvements when publishing a workbook.
Visualization Extensions. Create more complex visualizations (like sunburst) with ease.

Augmented Analytics & Citizen Data Science

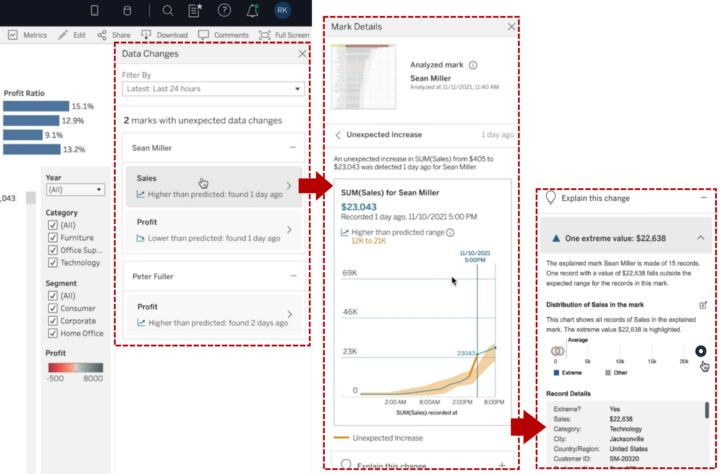
This topic has been in the Gartner’s hype cycle for some time. In Tableau we have already seen the first capabilities related to augmented analytics and autoML, but this area is really getting a lot more power in the future. Data change radar will automatically detect new outliers or anomalies in the data, and alert and visualize those to the user. Then users can apply the explain data feature to automatically get insights and explanations about the data, what has happened and why. Explain the viz feature will not explain only one data point but the whole visualization or dashboard and show descriptive information about the data. All this happens automatically behind the scenes and it can really speed up the analysis to get these insights out-of-the-box. There were also a bunch of smaller improvements in the Ask Data feature for example to adjust the behavior and to embed the ask data functionality.

One of the biggest new upcoming features was the possibility to create and deploy predictive models within Tableau with Tableau Model Builder. This means citizen data scientists can create autoML type of predictive models and deploy those inside Tableau to get new insights about the data.  The user interface for this seemed to be a lot like Tableau Prep. Another very interesting feature was Scenario Planning, which is currently under development in Tableau Labs. This feature gives the possibility to view how changes in certain variables would affect defined target variables and compare different scenarios to each other. Another use case for scenarios would be finding different ways to achieve a certain target. For me the scenario planning seemed to be a bit disconnected from the core capabilities of Tableau, but it is under development and for sure there could be some very nice use cases for this type of functionality.

  • Data Change Radar (2022 H1): Alert and show details about meaningful data changes, detect new outliers or anomalies, alert and explain these.
  • Explain the Viz (2022 H2): Show outliers and anomalies in the data, explain changes, explain mark etc.
  • Multiple Smaller Improvements in Ask Data (2022 H1): Contact Lens author, Personal pinning, Phrase builder, Lens lineage in Catalog, Embed Ask Data.
  • Tableau Model Builder: Use autoML to build and deploy predictive models within Tableau.
  • Scenario Planning: View how changes in certain variables affect target variables and how certain targets could be achieved.
Explain Data side pane with data changes and explain change drill down path.

Collaborate, embed and act

The Tableau Slack integration is getting better and more versatile. With the 2021.4 version you can use Tableau search, Explain Data and Ask Data features directly in Slack. As it was said in the event: “it’s like having data as your Slack member“. In the future also Tableau Prep notifications can be viewed via Slack. It was also suggested that later on similar integration will be possible for example with MS Teams.

There were many new capabilities related to embedding contents to external services. With Connected Apps feature admins can define trusted applications (secure handshake) to make embedding more easy. Tableau Broadcast can be used in Tableau Online to share content via external public facing sites for everyone (for unauthenticated users). There was also a mention about 3rd party identity and access provider support which was not very precise but in my opinion it suggests the possibility to more easily leverage identities and access management from outside Tableau. Embeddable web authoring makes it possible to create and edit contents directly within the service where contents are embedded using the web edit, so no need to use Tableau Desktop.

One big announcement was the Tableau Actions. Tableau dashboards already have great actions to create interactions between the user and the data, but this is something more. With Tableau Actions you can trigger actions outside Tableau directly from a dashboard. You could for example trigger Salesforce Flow tasks by clicking a button in the dashboard. And in the future also other workflow engines will be supported. This will provide much more powerful interactivity options for the user.

  • Tableau search, Explain Data and Ask Data in Slack (2021.4)
  • Tableau Prep notifications in Slack (2022 H1)
  • Connected Apps (2021.4): More easily embed to external apps, create secure handshake between Tableau and other apps.
  • Tableau Broadcast (2022 H2): Share contest via external public facing site to give access to unauthenticated users, only Tableau Online.
  • 3rd party Identity & Access Providers: Better capabilities to manage users externally outside Tableau.
  • Embeddable Web Authoring: No need for desktop when creating & editing embedded contents, full embedded visual analytics.
  • Embeddable Ask Data 
  • Tableau Actions: Trigger actions outside Tableau, for example Salesforce Flow actions, later on support for other workflow engines.
Creating new Tableau Action to trigger Salesforce Flow to escalate case.

Data management & data preparation

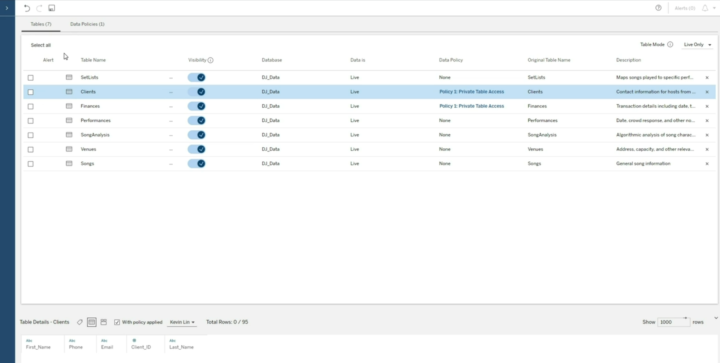
Virtual Connections have already been introduced earlier and those seem to be very powerful functionality to centrally manage data connections and create centralized row level security rules. These functionalities and possible new future features build around them can really boost end-to-end self-service analytics in the future. The only downside is that this is part of the data management add-on. Data Catalog Integration will bring the possibility to sync metadata from external data catalog services, like Collibra and Alation.

Related to the data preparation there will be new Tableau Prep Extensions so you can get more power to the prep workflows as a custom step. These new steps can be for example sentiment analysis, geocoding, feature engineering etc. Other new functionality in Tableau Prep is the possibility to use parameters in the Prep workflows. It was also said that in the future you can use Tableau Public to publish and share Tableau Prep flows. This might mean there is also a Public version coming for Tableau Prep. It wasn’t mentioned in the event, but it would be great.

  • Virtual Connections (2021.4): Centrally managed and reusable access points to source data with single point to define security policy and data standards.
  • Centralized row level security (2021.4): Centralized RLS and data management for virtual connections.
  • Data Catalog Integration: Sync external metadata to Tableau (from Collibra, Alation, & Informatica).
  • Tableau Prep Extensions: Leverage and build extension for Tableau Prep (sentiment analysis, OCR, geocoding, feature engineering etc.).
  • Parameters in Tableau Prep (2021.4): Leverage parameters in Tableau Prep workflows.
Content of a virtual connection and related security policies.

Server Management

Even though SaaS options like Tableau Online are getting more popular all the time there was still a bunch of new Tableau Server specific features. New improved resource monitoring capabilities as well as time stamped log file zip generation were mentioned. Backgrounder resource limits can limit the amount of resources consumed by backgrounder processes and auto-scaling for backgrounders for containerized deployments can help the environment to adjust for different workloads during different times of the day.

  • Resource Monitoring Improvements (2022 H1): Show view load requests, establish new baseline etc.
  • Time Stamped log Zips (2021.4)
  • Backgrounder resource limits (2022 H1): Set limits for backgrounder resource consumption.
  • Auto-scaling for backgrounder (2022 H1): Set backgrounder auto-scaling for container deployments.

Tableau Ecosystem & Tableau Public

Tableau is building Tableau Public to better serve the data family in different ways. There is already a possibility to create visualizations in Tableau Public using the web edit. There is also redesigned search and better general user interface to structure and view contents as channels. Tableau Public will also have Slack integration and more data connectors for example to Dropbox and OneDrive. As already mentioned, Tableau Prep flows can be published to Tableau Public in the future and that might also mean a release of Tableau Prep Public, who knows.

In the keynote there was also mention that Tableau exchange would contain all the different kinds of extensions, connectors, datasets and accelerators in the future. The other contents are already there but the datasets will be a very interesting addition. This would mean companies could publish, use and possibly sell and buy analysis ready data contents. The accelerators are dashboard starters for certain use cases or source data.

  • Tableau Public Slack Integration (2022 H1)
  • More connectors to Tableau Public (2022 H1): Box, Dropbox, OneDrive.
  • Publish Prep flows to Tableau Public: Will there be a Public version for Tableau Prep?
  • Tableau Public custom Channels (2022 H1):  Custom channels around certain topics.
  • Tableau exchange: Search and leverage shared extensions, connectors, datasets and accelerators.
  • Accelerators: Dashboard starters for certain use cases and source data (e.g. call center analysis, Marketo data, Salesforce data etc.).

Want to read or hear more?

If you are looking for more info about Tableau read our blog post: Tableau – a pioneer of modern self-service business intelligence.

More info about the upcoming features on the Tableau coming soon page.
You can also read about our visual analytics services and contact to hear more or to see a comprehensive end-to-end Tableau Demo.

Thanks for reading!

Tero Honko, Senior Data Consultant
tero.honko@solita.fi
Phone +358 40 5878359