AWS forecast service modelling Electricity consumption

Timeseries forecasting often requires significant mathematical knowledge and domain experience. This area of machine learning is often only accessible to experts, however, Amazon Forecast provides a simple and intuitive interface for creating complex machine learning models.

Timeseries forecasting is the process of looking at historical data to make predictions about the future. Companies can use these predictions to extract actionable insights that drive innovation. Often, the mechanisms behind the transformation of raw data into business value is a mystery to non-specialists. This is because timeseries forecasting requires expert knowledge of algorithms and mathematical concepts such as calculus. This is a domain reserved for the highly trained specialists, often not accessible to the average user. However, with the development of Amazon Forecast this could be changing.

Amazon Forecast is a fully managed service that simplifies the process of timeseries forecasting by hiding the inner complexity from the users. The user simply has to provide an input data, Forecast then automatically applies and selects the most optimal machine learning algorithm for the data to generate accurate predictions with little to no user intervention. This system is known as a ‘Black Box Method’, where a user can conduct complex modelling tasks without worrying about the low-level calculus and algorithms.

This movement of machine learning from experts to general users marks a significant paradigm shift known as AutoML (Automatic Machine Learning).

Within this blog Amazon Forecast will be explored from the perspective of a non-expert general user to assess how easy it is to get started producing accurate future predictions. In other words, can someone who is not a professional machine learning specialist produce professional models?

What we will predict

In this hypothetical scenario we work for an electricity provider and have been tasked with building a model to predict future electricity consumption for our customers. The input data we have been provided contains measurements for electricity consumption (Kw) every hour for 370 different clients from January 2014 – November 2014. This dataset contains 2,707,661 observations. We will build a model to predict the electricity consumption for the 1st of October 2014, so 24 hours into the future for every customer.

Creating the electricity forecast

 Unfortunately, Forecast is not able to clean and prepare your input data, you must ensure the data is prepared beforehand. This is the only technical step that is required in the forecasting process. In this instance, we prepare the dataset to match the schema requirements of Forecast as shown in the table below. Once prepared the data must be stored in an S3 as a CSV.


Client Timestamp Consumption
Client_1 2014-01-01 01:00:00 23.64
Client_0 2014-0101 02:00:00 9.64


As a general user we can achieve everything we need to generate a forecast within the Forecast Console. This is a no-code user interface in the form of a Dashboard. Within this dashboard we can manage all aspects of the forecasting process, this process is implemented in 3 easy steps:

  1.   First, you import your Target time series data. This is simply the process of telling Forecast where to find your prepared data in S3 and how to read the contents (schema).
  2.       Next, you use this Target time series to create a predictor. A predictor is a Forecast model trained on your timeseries. This is where the AutoML aspects of Forecast are truly utilised. When training a predictor in a typical timeseries forecast, the user would need to identify the optimal algorithm to train the model and then optimise this model. Within Forecast, all of these steps are done automatically using back testing. Back testing is the process of retaining a portion of the training data to train on all the algorithms to find the best fit.
  3.       Finally, with the model trained, we can generate a forecast. This is as simple as a few clicks on the dashboard. This will generate future predictions of energy consumption for every hour for every customer.

Now, with zero coding or expert input we have generated an advanced forecast utilising cutting-edge deep learning machine learning algorithm. If it appears very simple, that’s because it is. The dashboard was designed to be simple and easy to use. For more advanced users Python can be used to connect to Forecast where you gain significantly more control over the process. But as a general user such control is not necessary.

Visualise and export the electricity consumption predictions

For this section we will visualise the forecasted predictions for customer 339, found in the graph below. As we actually have the real observed values for the 1st of October 2014, we can compare our predictions with the actual observed electricity consumption.
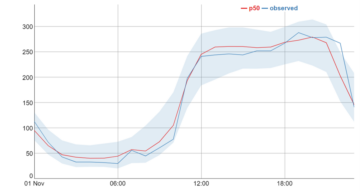
In the graph the darker blue line represents the real values. We can also see a red line and a light blue area. This blue area is known as the 80% confidence interval, indicating that we are 80% confident that the real value will lie somewhere within this area. The red line, p50 value (median forecast) can be considered as an indication of the ‘most likely outcome’.

As we can see, our forecast appears to be very accurate in predicting the electricity consumption for this customer, with the predicted values closely following the observed values. In practice, these forecasts could be used in a variety of ways. For example, we could share this forecast with the customer, who can then adjust their consumption patterns to reduce energy usage during peak hours and thus lower energy bills. For the energy provider, these forecasts could be used in load management and capacity planning.

Conclusion

The main purpose of Forecast and AutoML is to allow non-experts to develop machine learning models without the required expertise. AutoML also enables experienced data scientists by reducing time spent optimising models. Forecast achieves both, as I, a non-expert, was able to develop an advanced forecasting model without any interaction with the complex underlying mechanisms. It is clear Forecast extends the power of time series forecasting to non-technical experts, empowering them to make informed decisions from machine learning insights.

A Beginner’s Guide to AutoML

In a world driven by data, Machine Learning plays the most central role. Not everyone has the knowledge and skills required to work with Machine Learning. Moreover, the creation of Machine Learning models requires a sequence of complex tasks that need to be handled by experts.

Automated Machine Learning (AutoML) is a concept that provides the means to utilise existing data and create models for non-Machine Learning experts. In addition to that, AutoML provides Machine Learning (ML) professionals ways to develop and use effective models without spending time on tasks such as data cleaning and preprocessing, feature engineering, model selection, hyperparameter tuning, etc.

Before we move any further, it is important to note that AutoML is not some system that has been developed by a single entity. Several organisations have developed their own AutoML packages. These packages cover a broad area, and targets people at different skill levels.

In this blog, we will cover low-code approaches to AutoML that require very little knowledge about ML. There are AutoML systems that are available in the form of Python packages that we will cover in the future.

At the simplest level, both AWS and Google have introduced Amazon Sagemaker and Cloud AutoML, which are low-code PAAS solutions for AutoML. These cloud solutions are capable of automatically building effective ML models. The models can then be deployed and utilised as needed.

Data

In most cases, a person working with the platform doesn’t even need to know much about the dataset they want to analyse. The work carried out here is as simple as uploading a CSV file and generating a model. We will take a look at Amazon Sagemaker as an example. However, the process is similar in other existing cloud offerings.

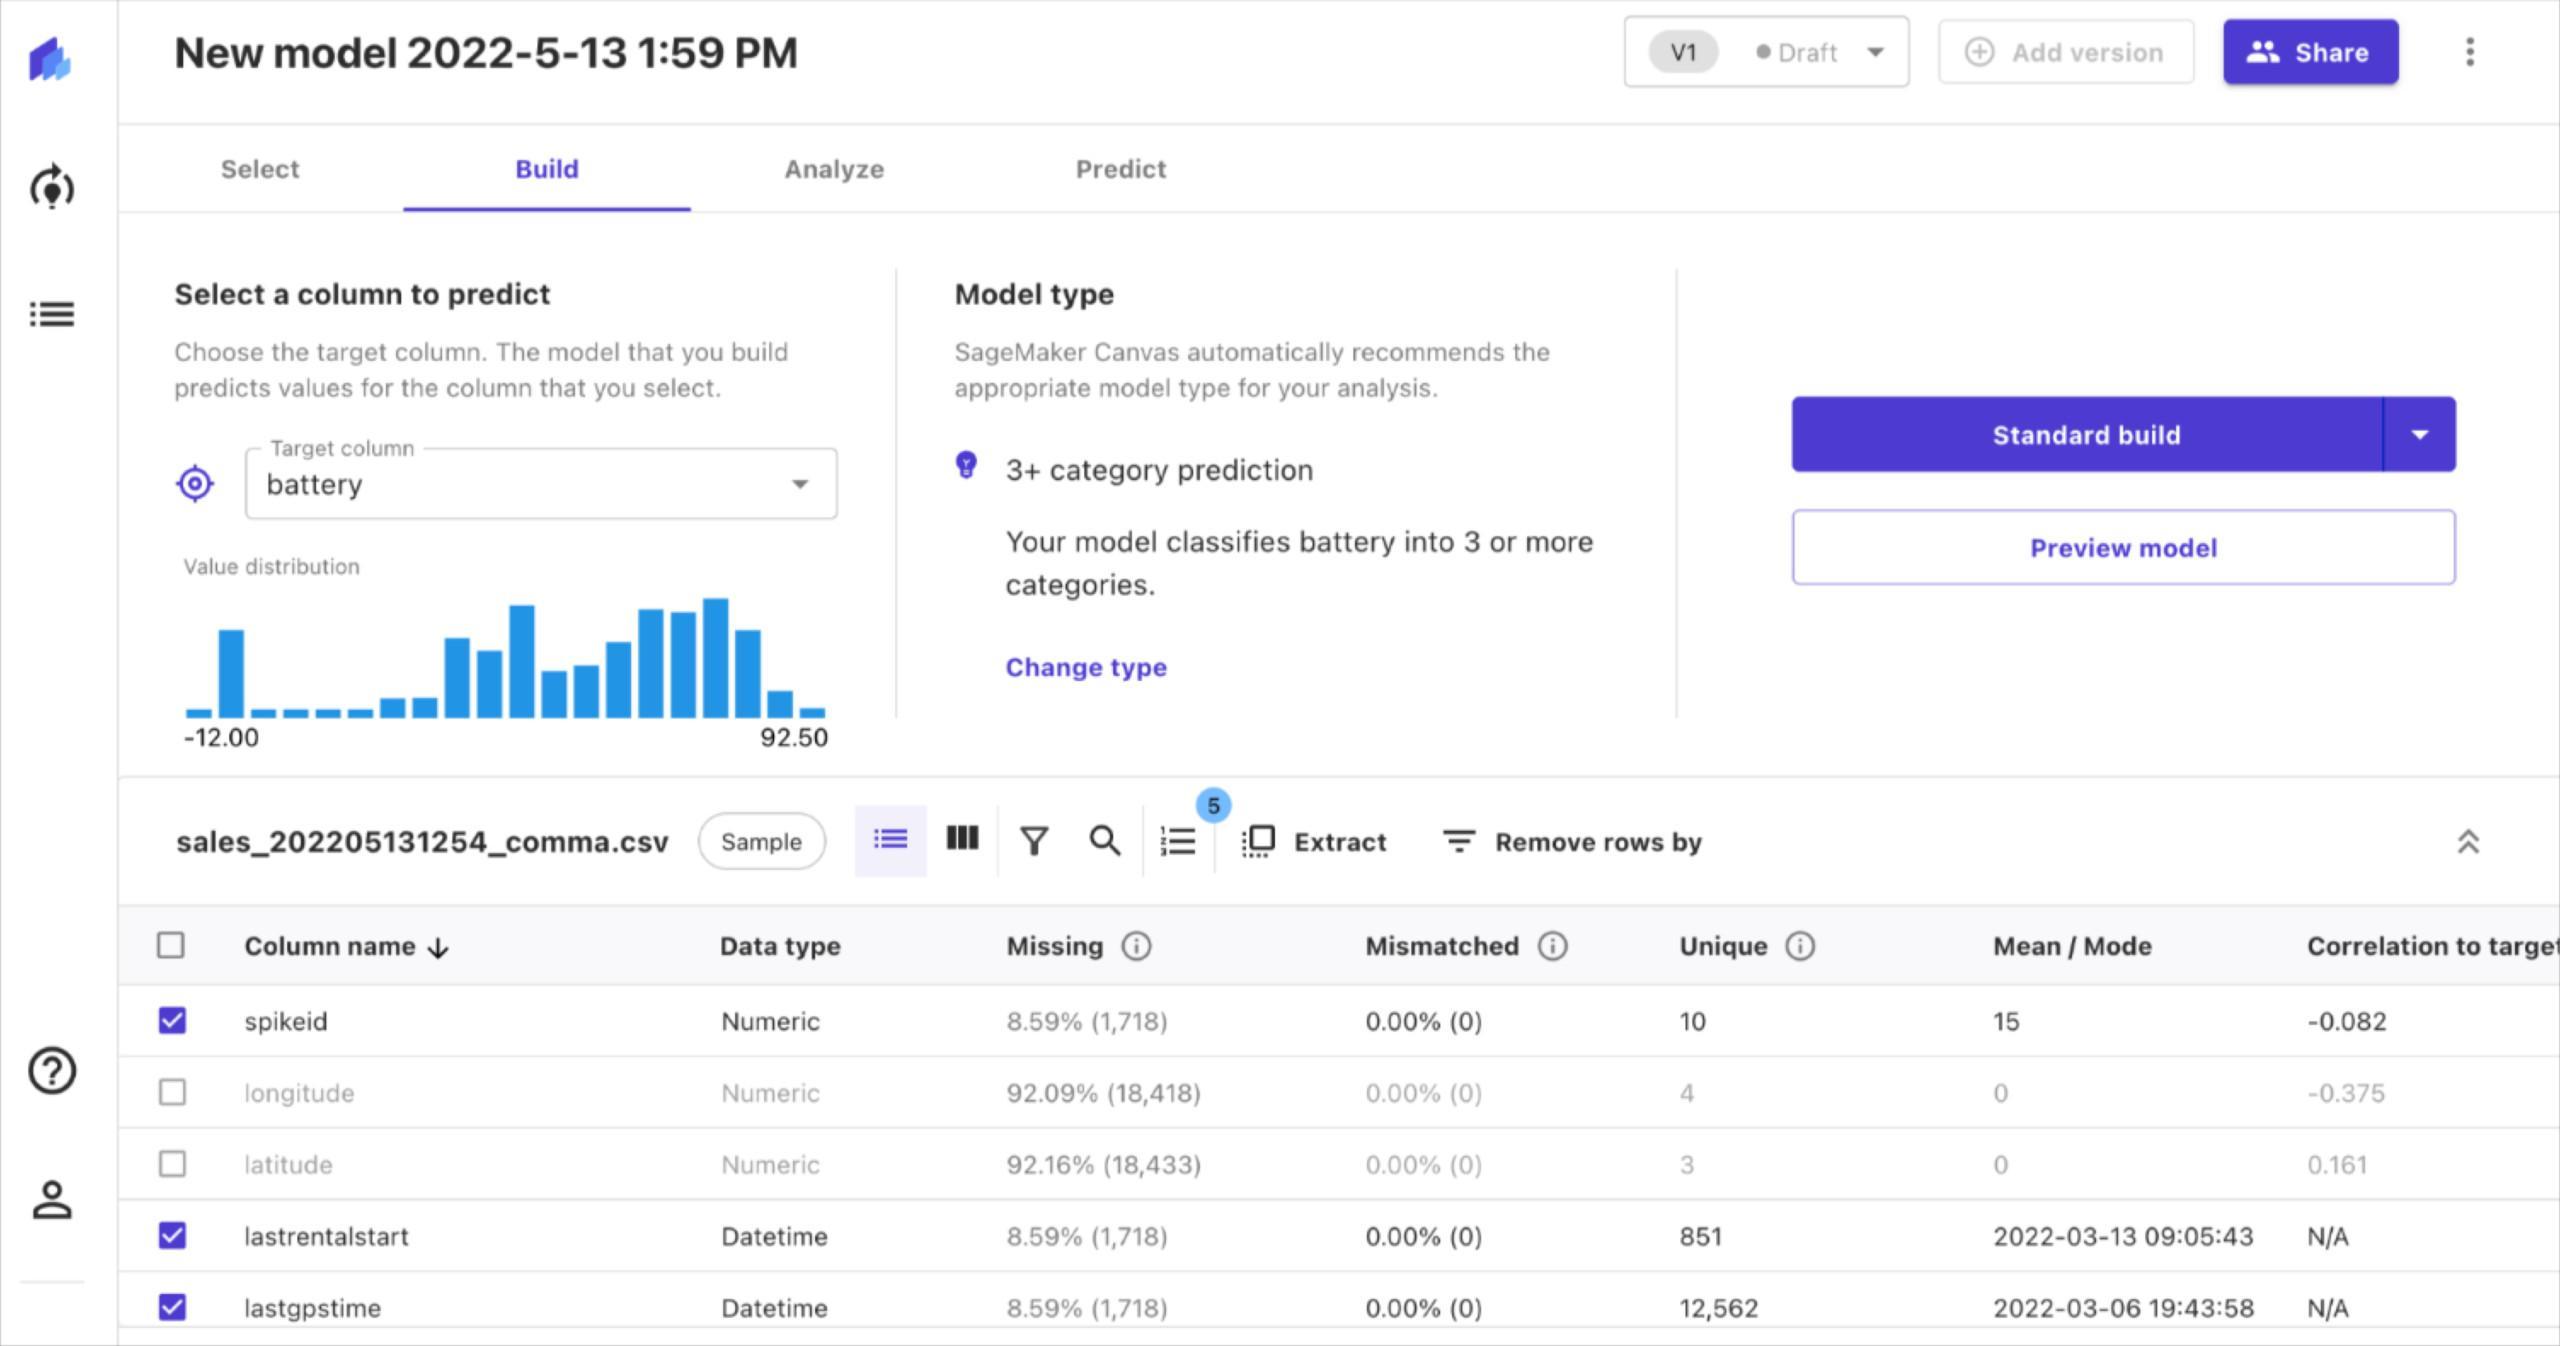
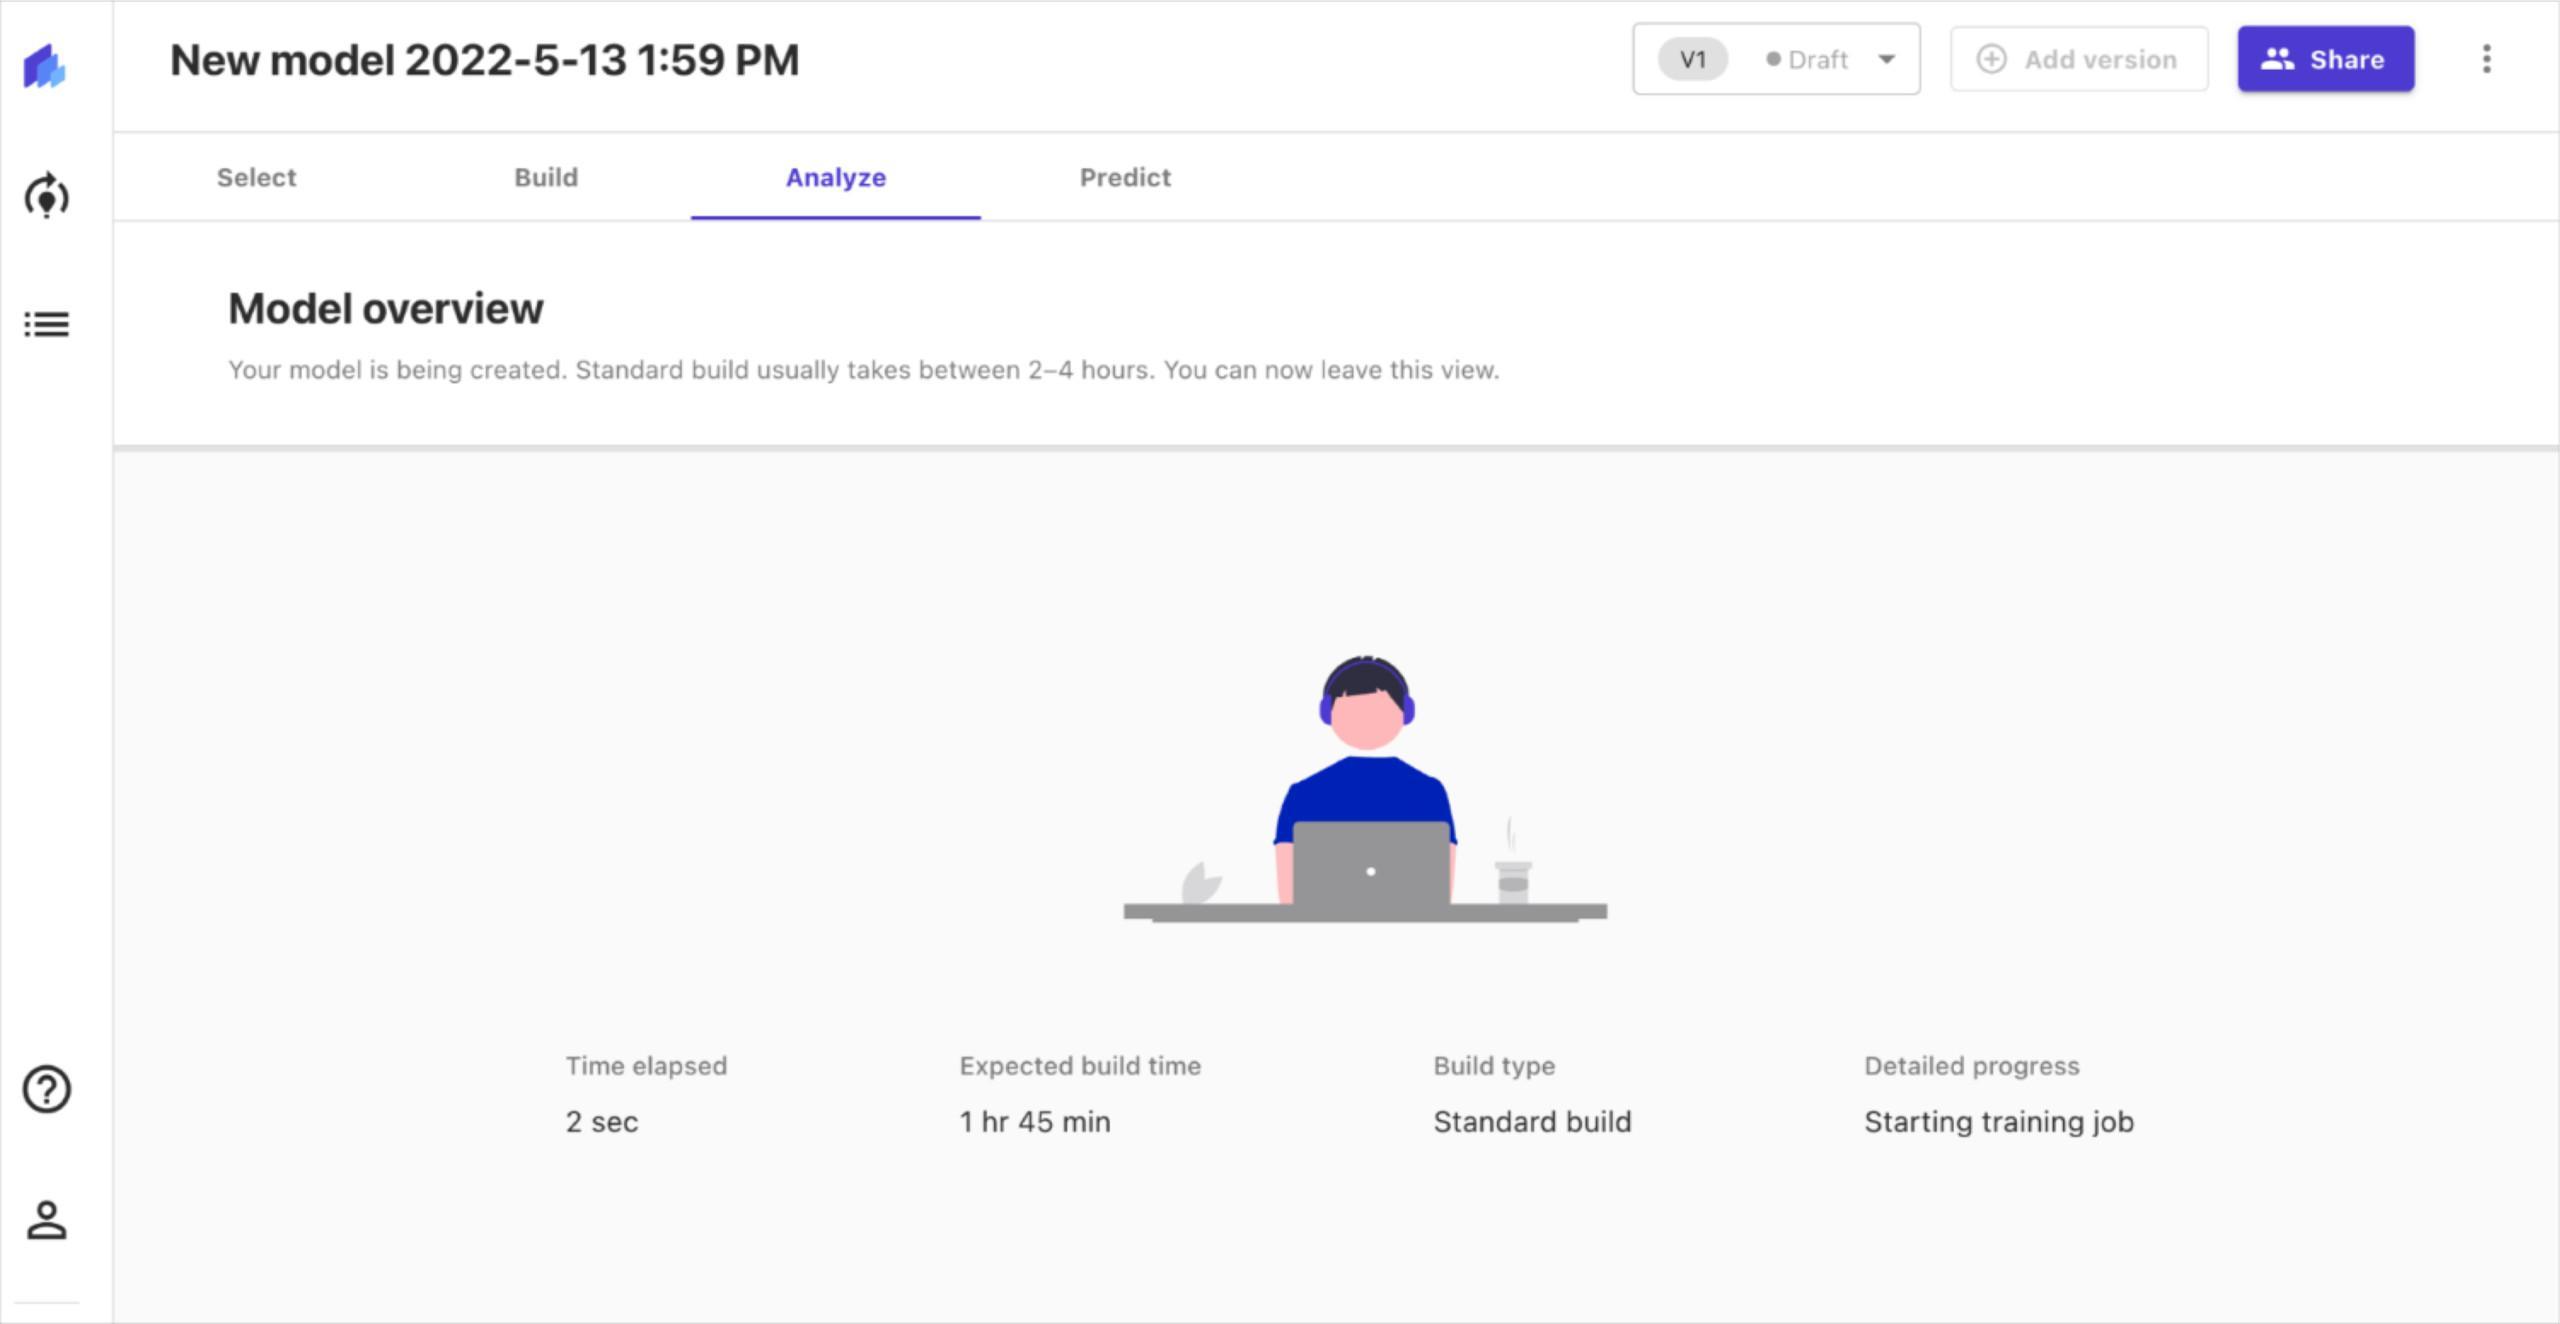
With Sagemaker, we can upload our dataset to an S3 bucket and tell our model that we want to be working with that dataset. This is achieved using Sagemaker Canvas, which is a visual, no code platform.

The dataset we are working with in this example contains data about electric scooters. Our goal is to create a model that predicts the battery level of a scooter given a set of conditions.

Creating the model

In this case, we say that our target column is “battery”. We can also see details of the other columns in our dataset. For example, the “latitude”and “longitude” columns have a significant amount of missing data. Thus, we can choose not to include those in our analysis.

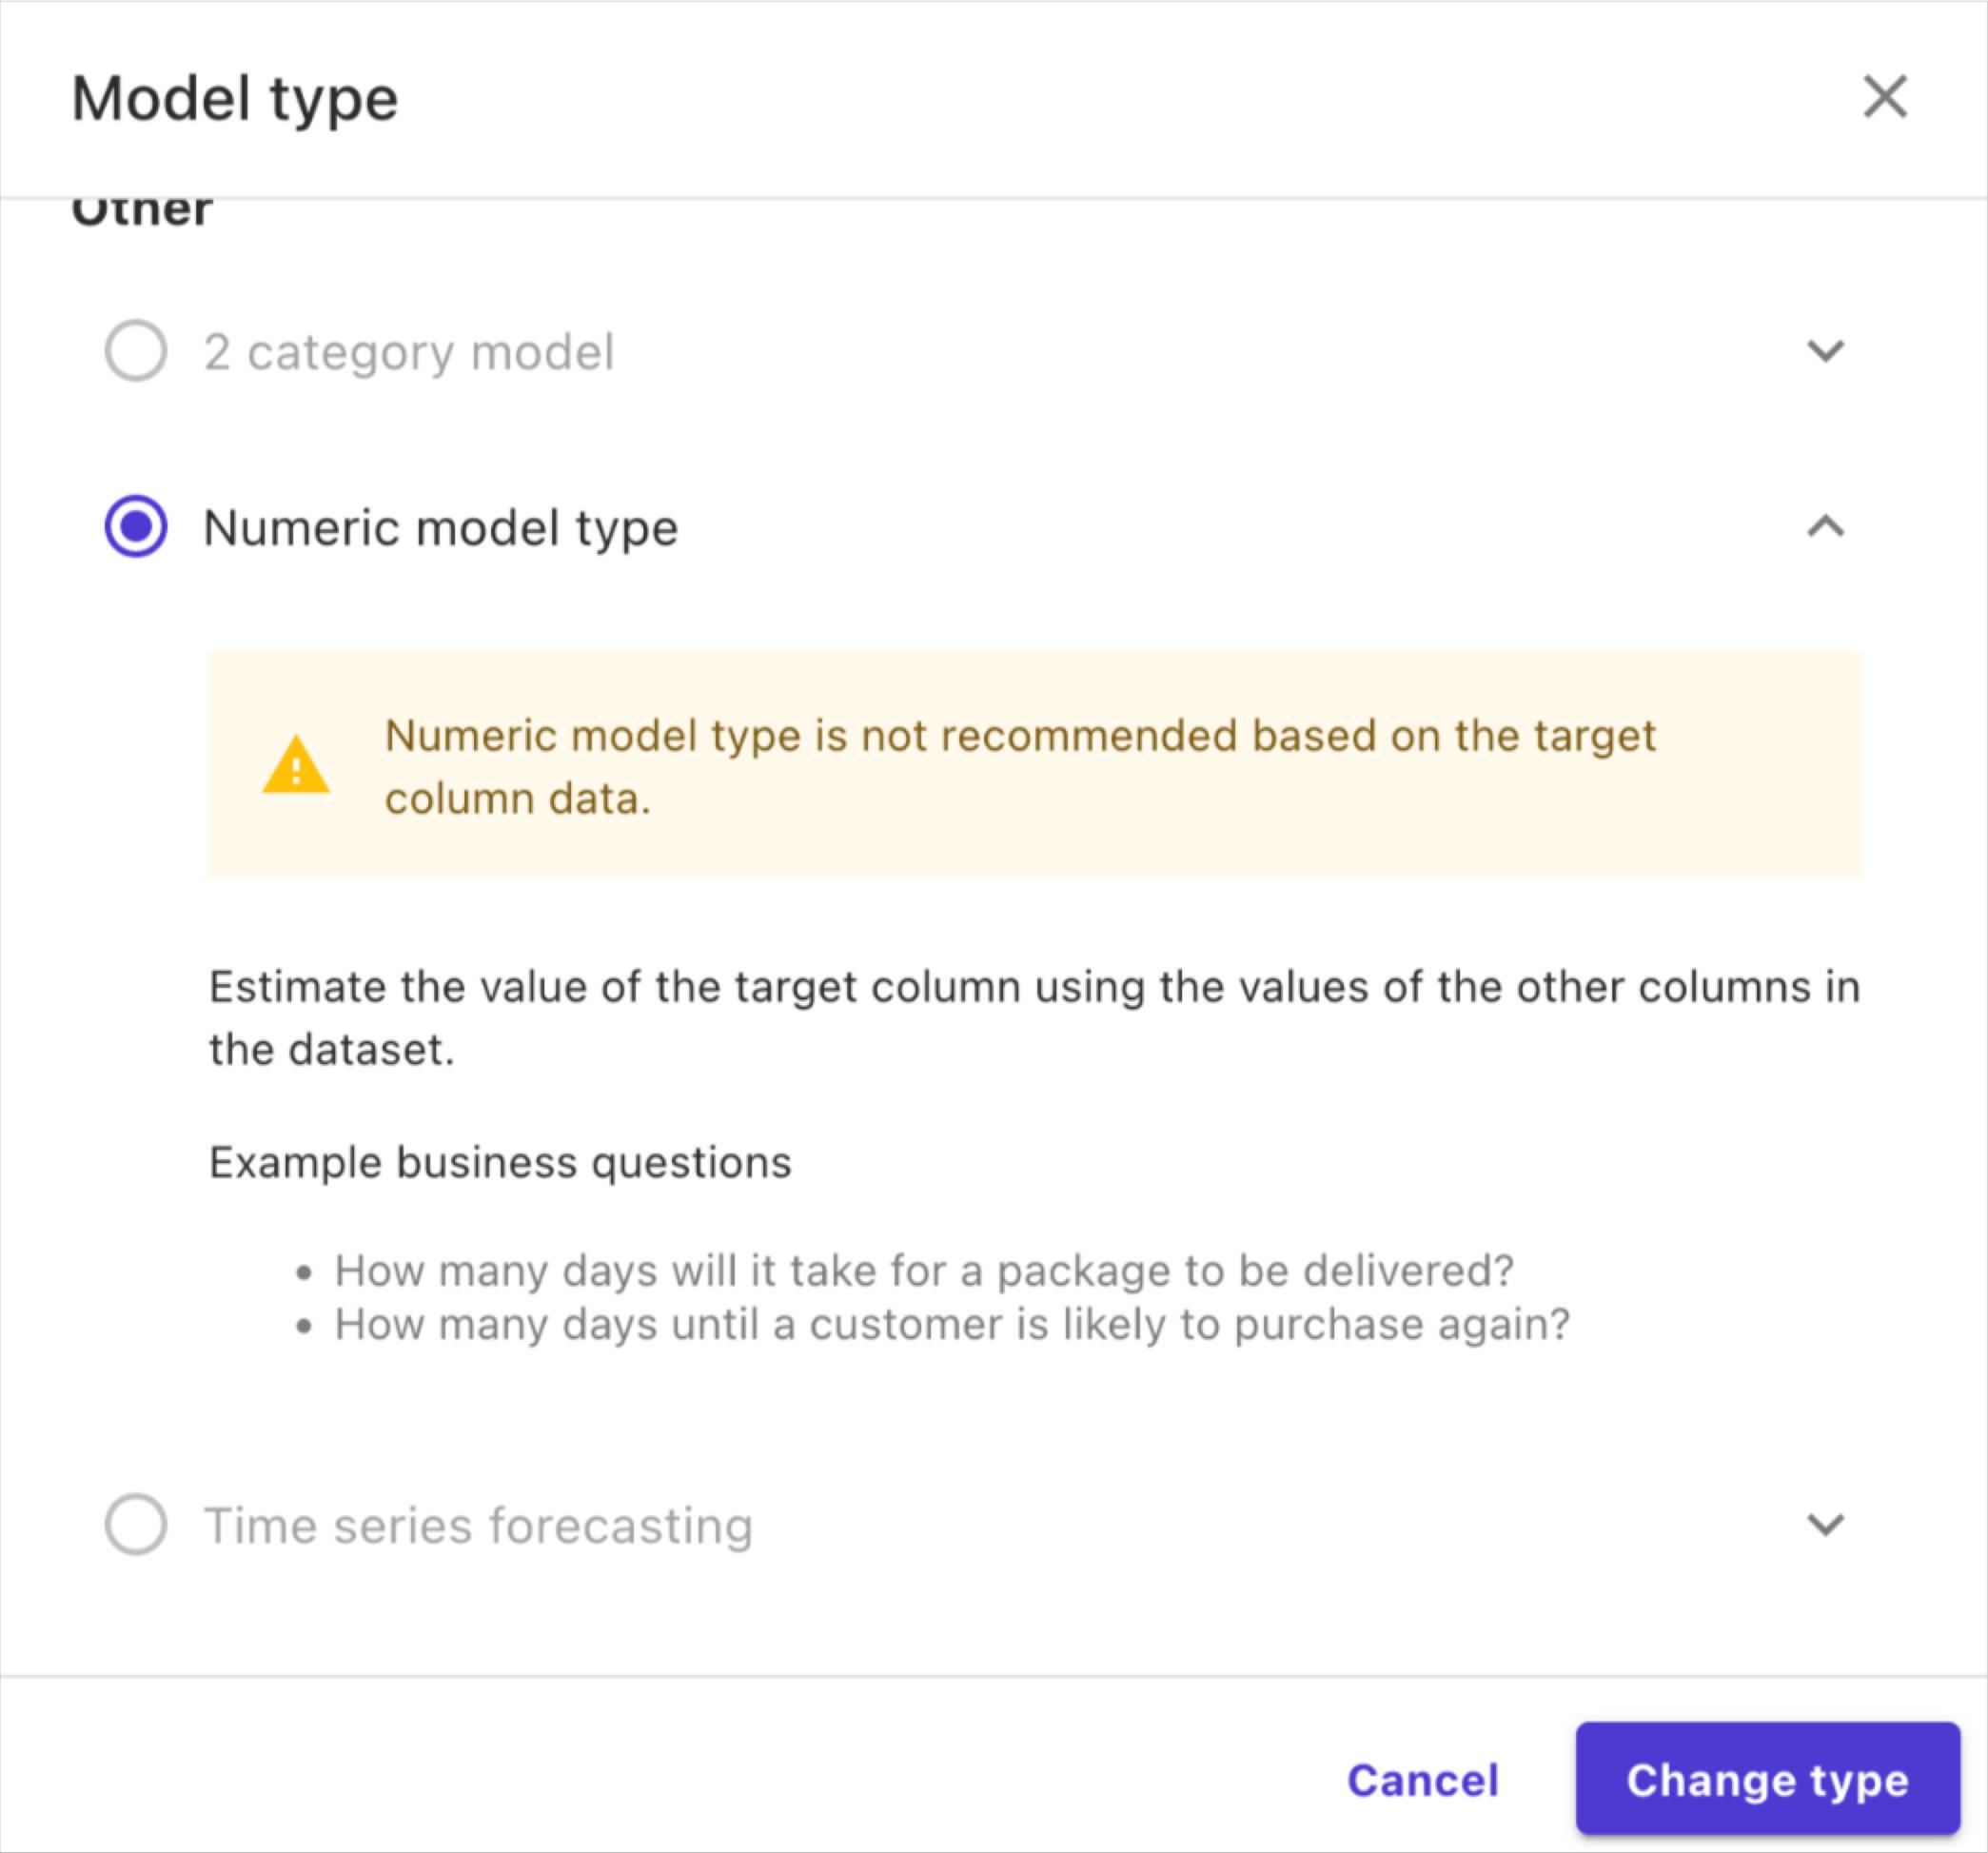
Afterwards, we can choose the type of model we want to create. By default, Sagemaker suggests creating a model that classifies the battery level into 3 or more categories. However, what we want is to predict the battery level.

Therefore, we can change the model type to “numeric” in order to predict battery level.

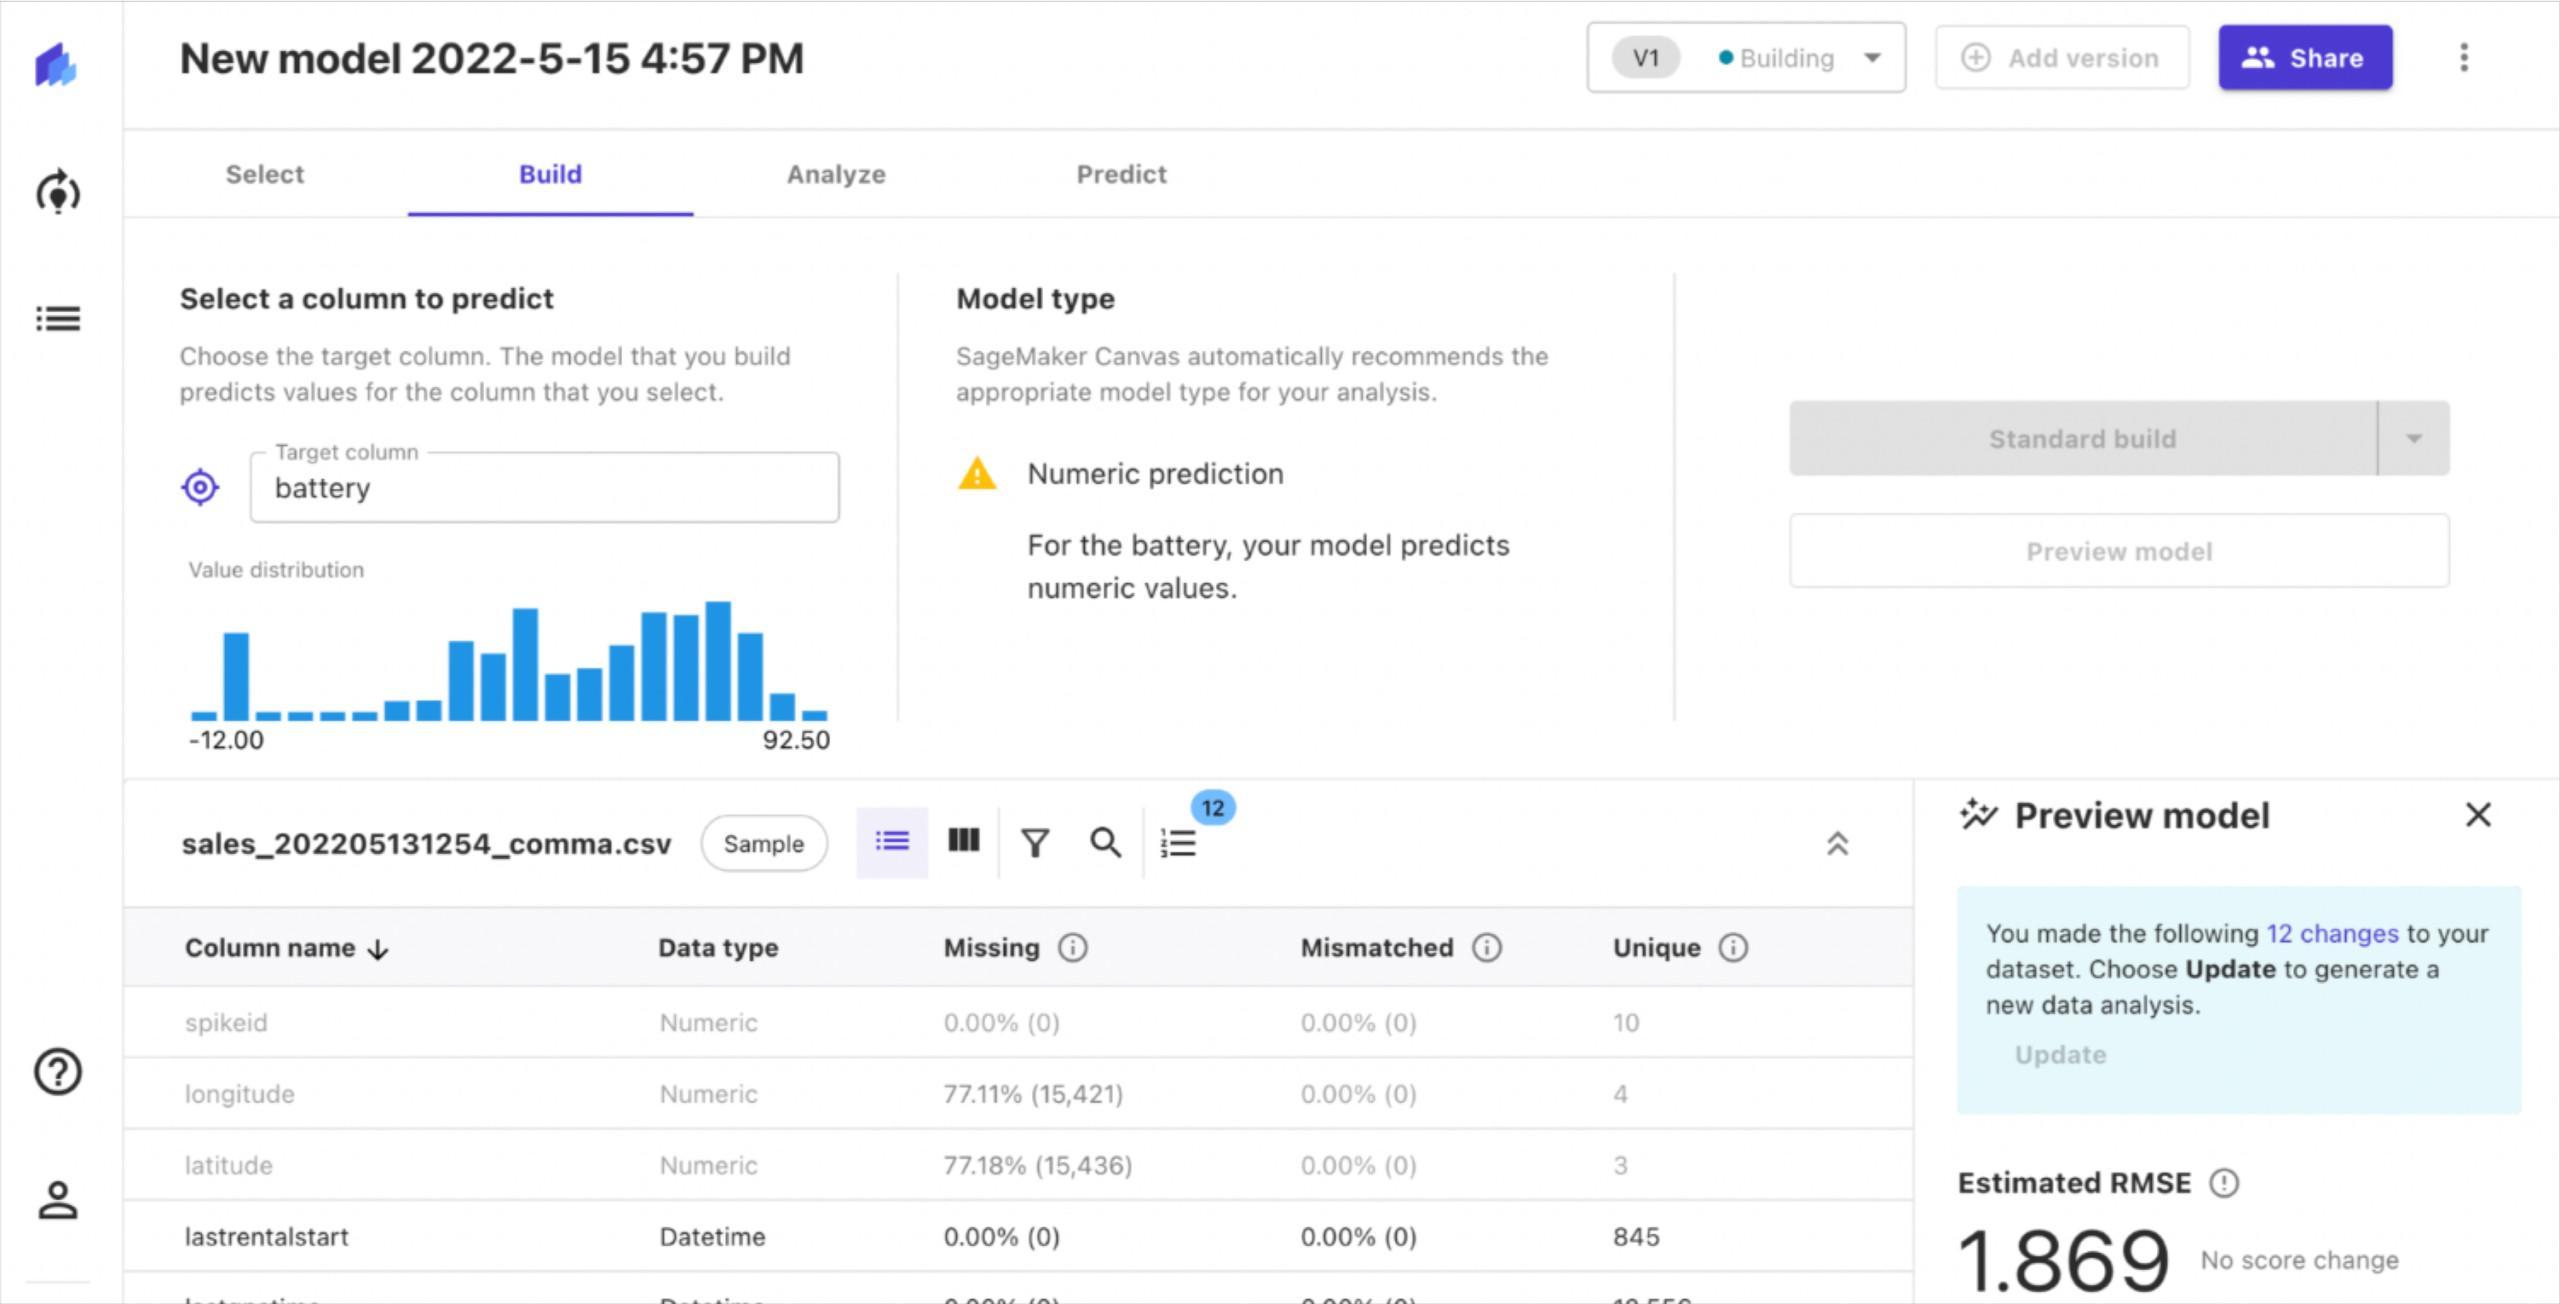
Thereafter, we can begin building our models. This is a process that takes a considerable amount of time. Sagemaker gives you the option to “preview” the model that would be built before starting the actual build.

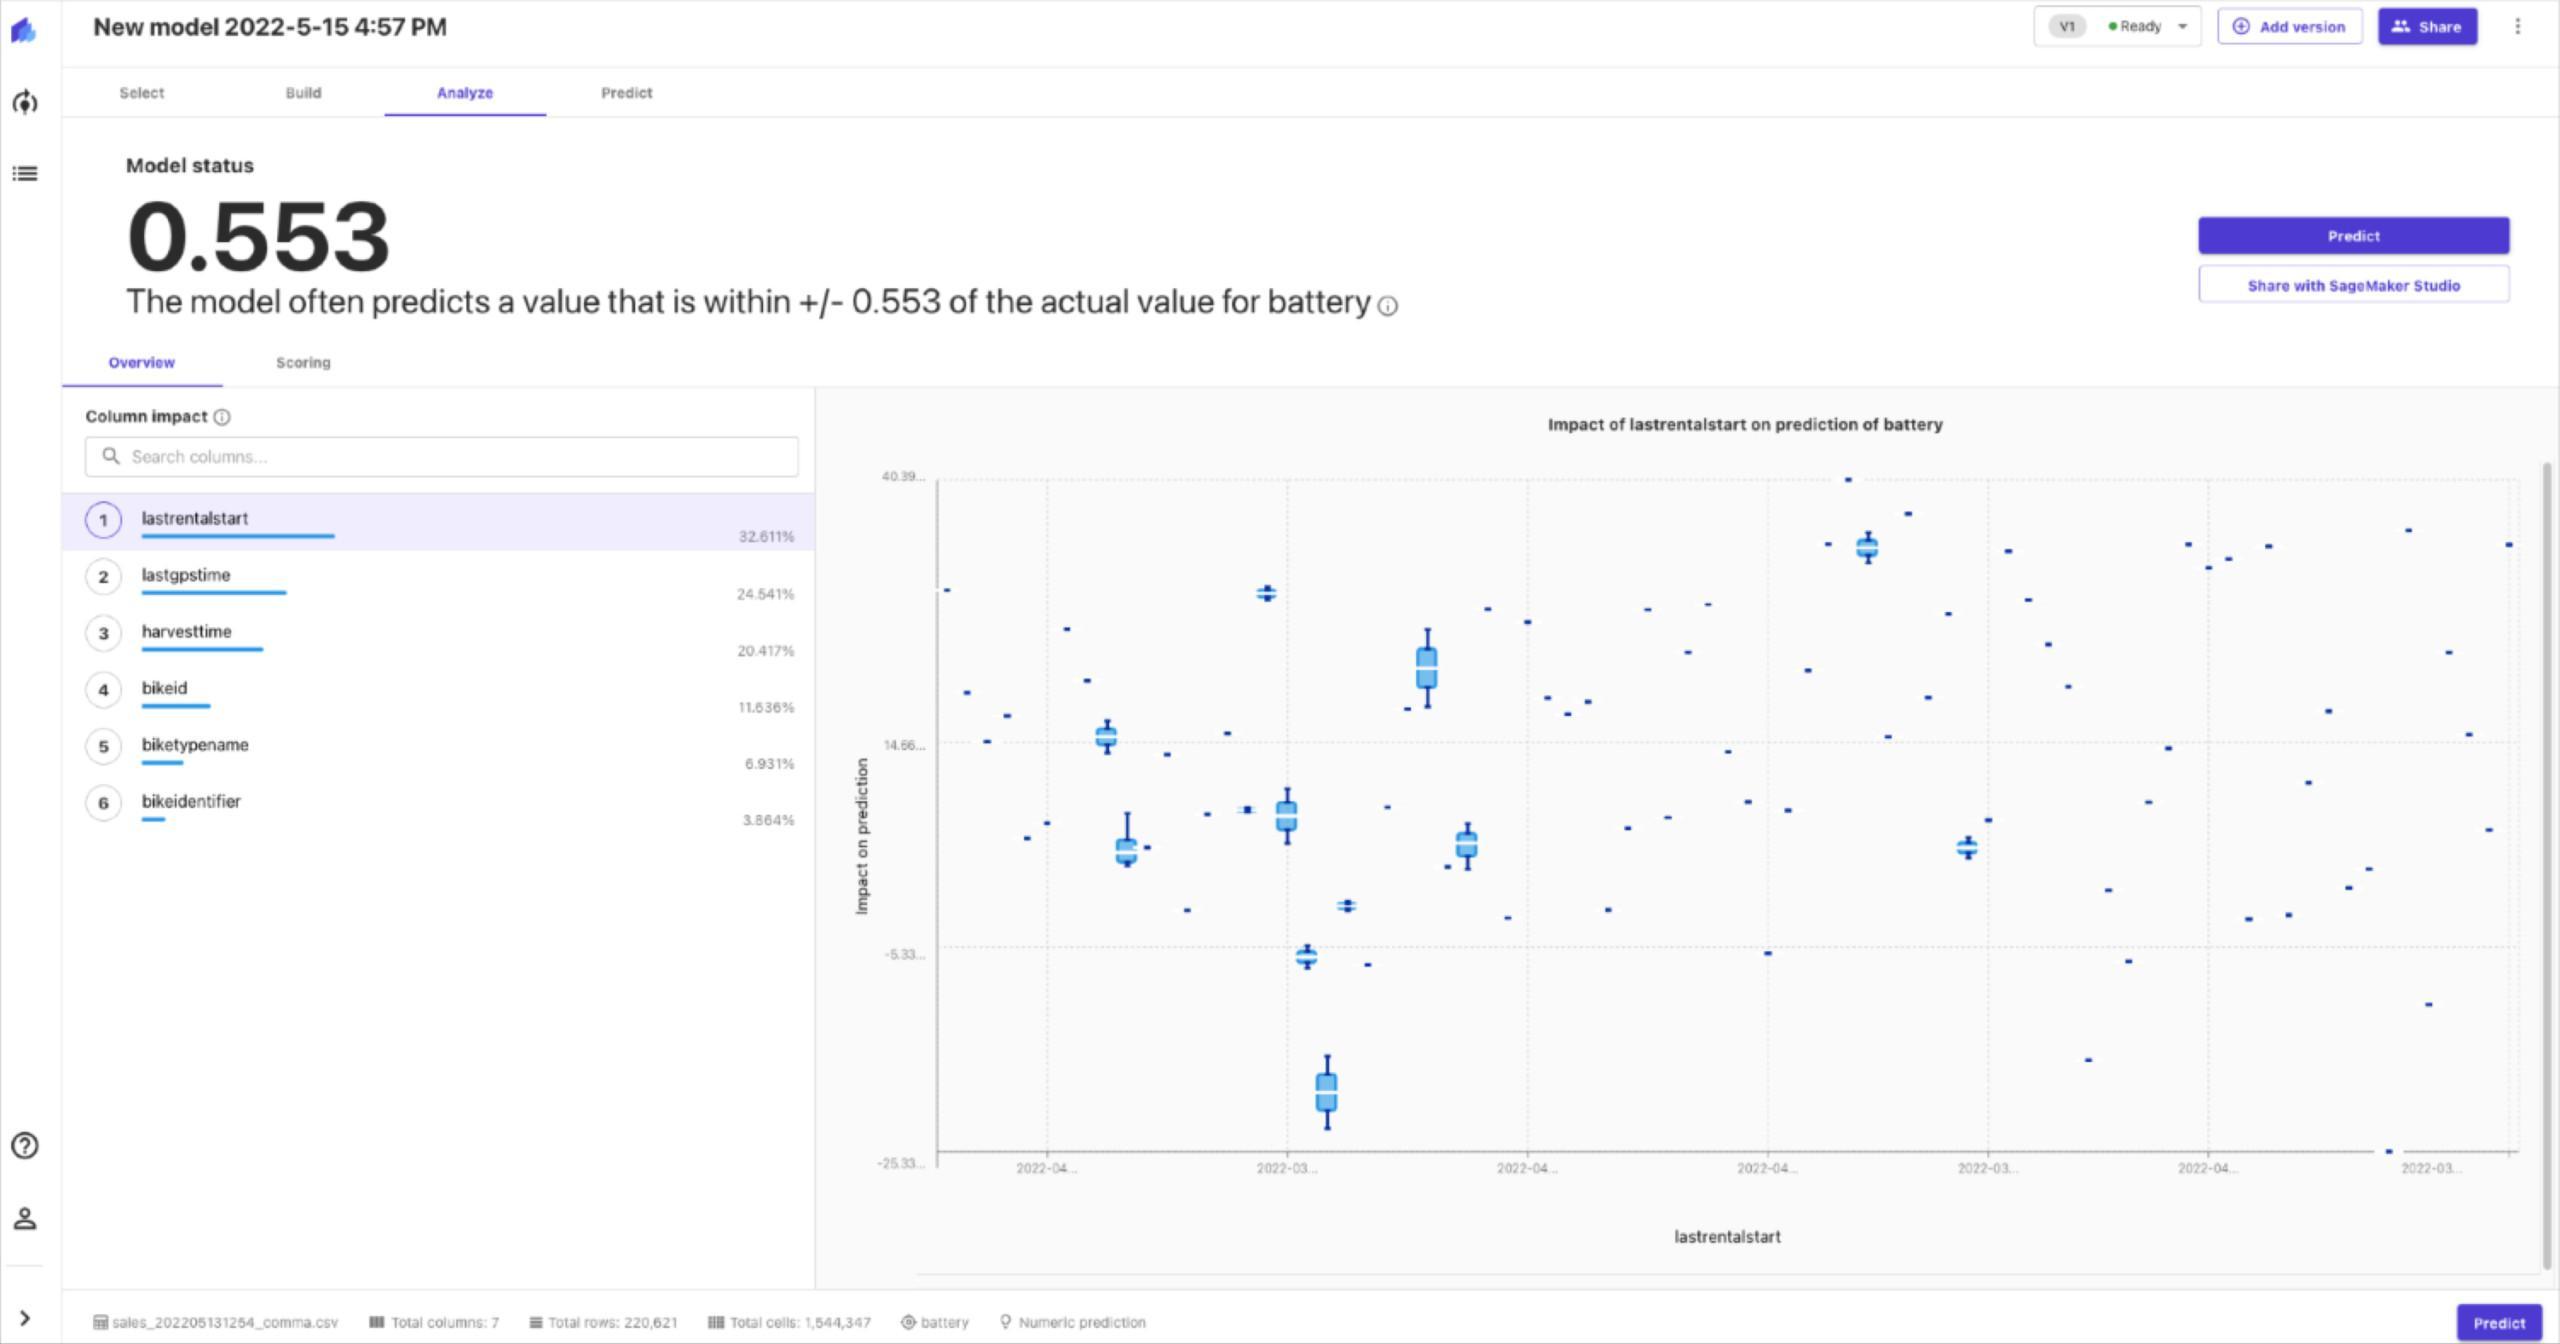
The preview only takes a few minutes, and provides an estimate of the performance we can expect from the final model. Since our goal is to predict the battery level, we will have a regression model. This model can be evaluated with RMSE (root mean square error).

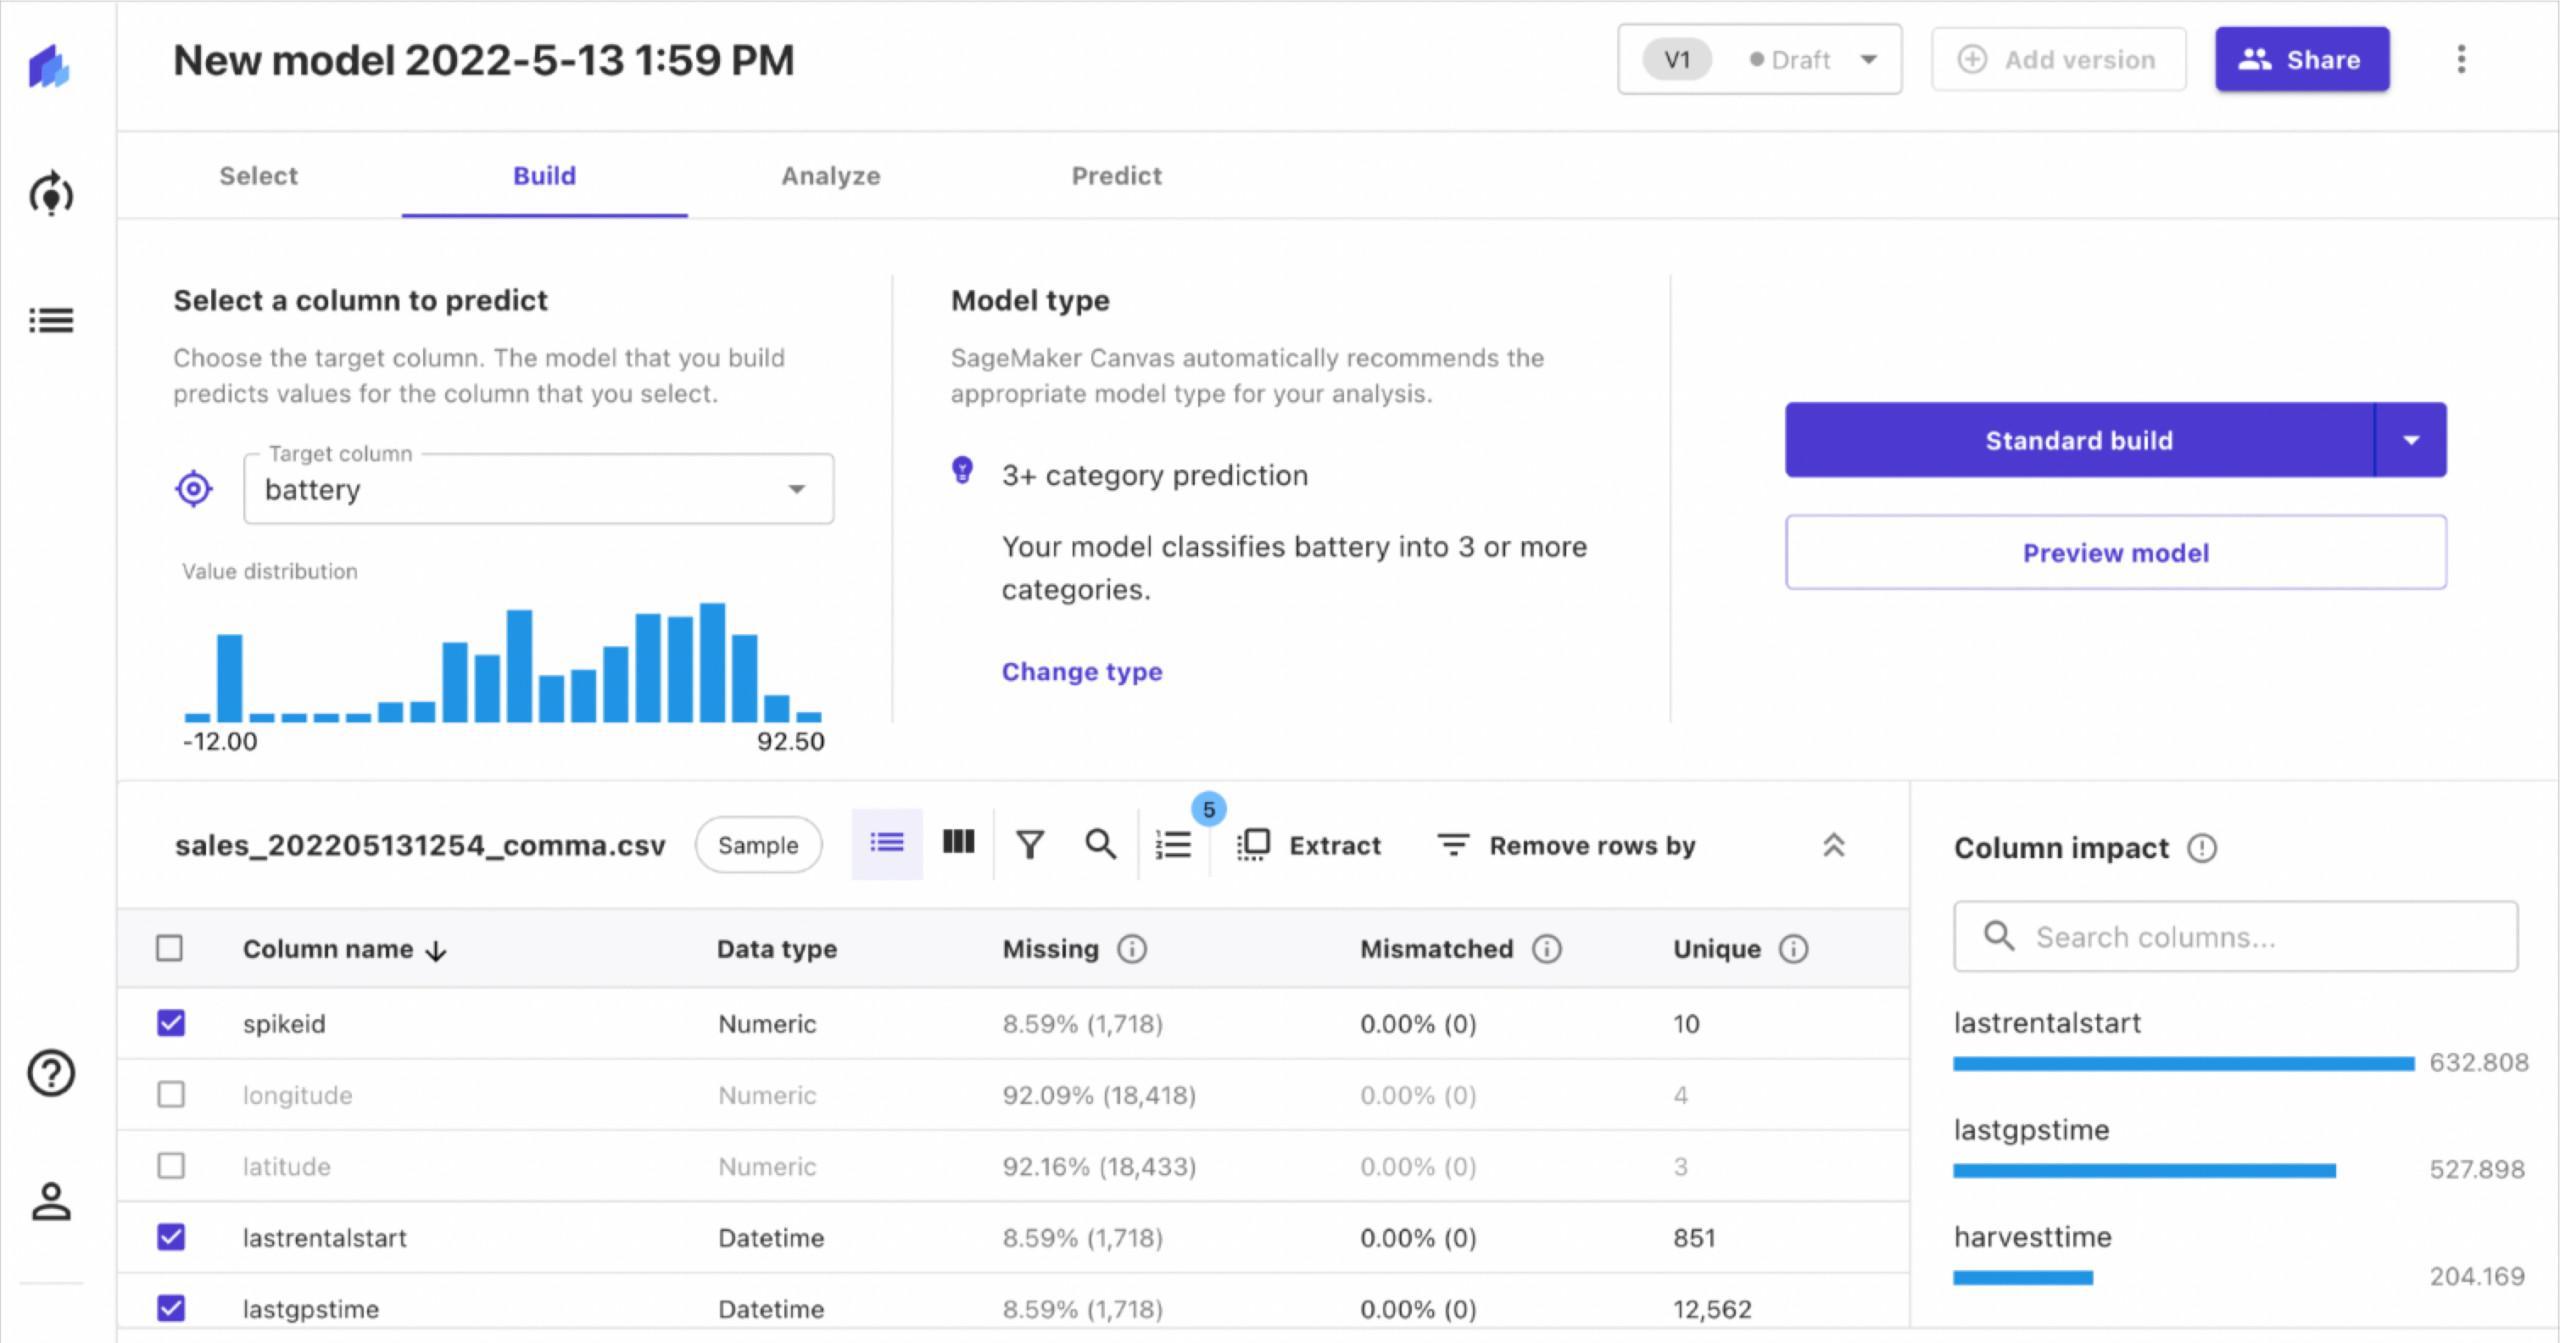
It also shows the impact different features have on the model. Therefore, we can choose to ignore features that have little or no impact.

Once we have selected the features we want to analyse, we select “standard build” and begin building the model. Sagemaker trains the dataset with different models along with multiple hyperparameter values for each model. This is done in order to figure out an optimal solution. As a result, the process of building the model takes a long time.

Once the build is complete, you are presented with information about the performance of the model. The model performance can be analysed in further detail with advanced metrics if necessary.

Making predictions

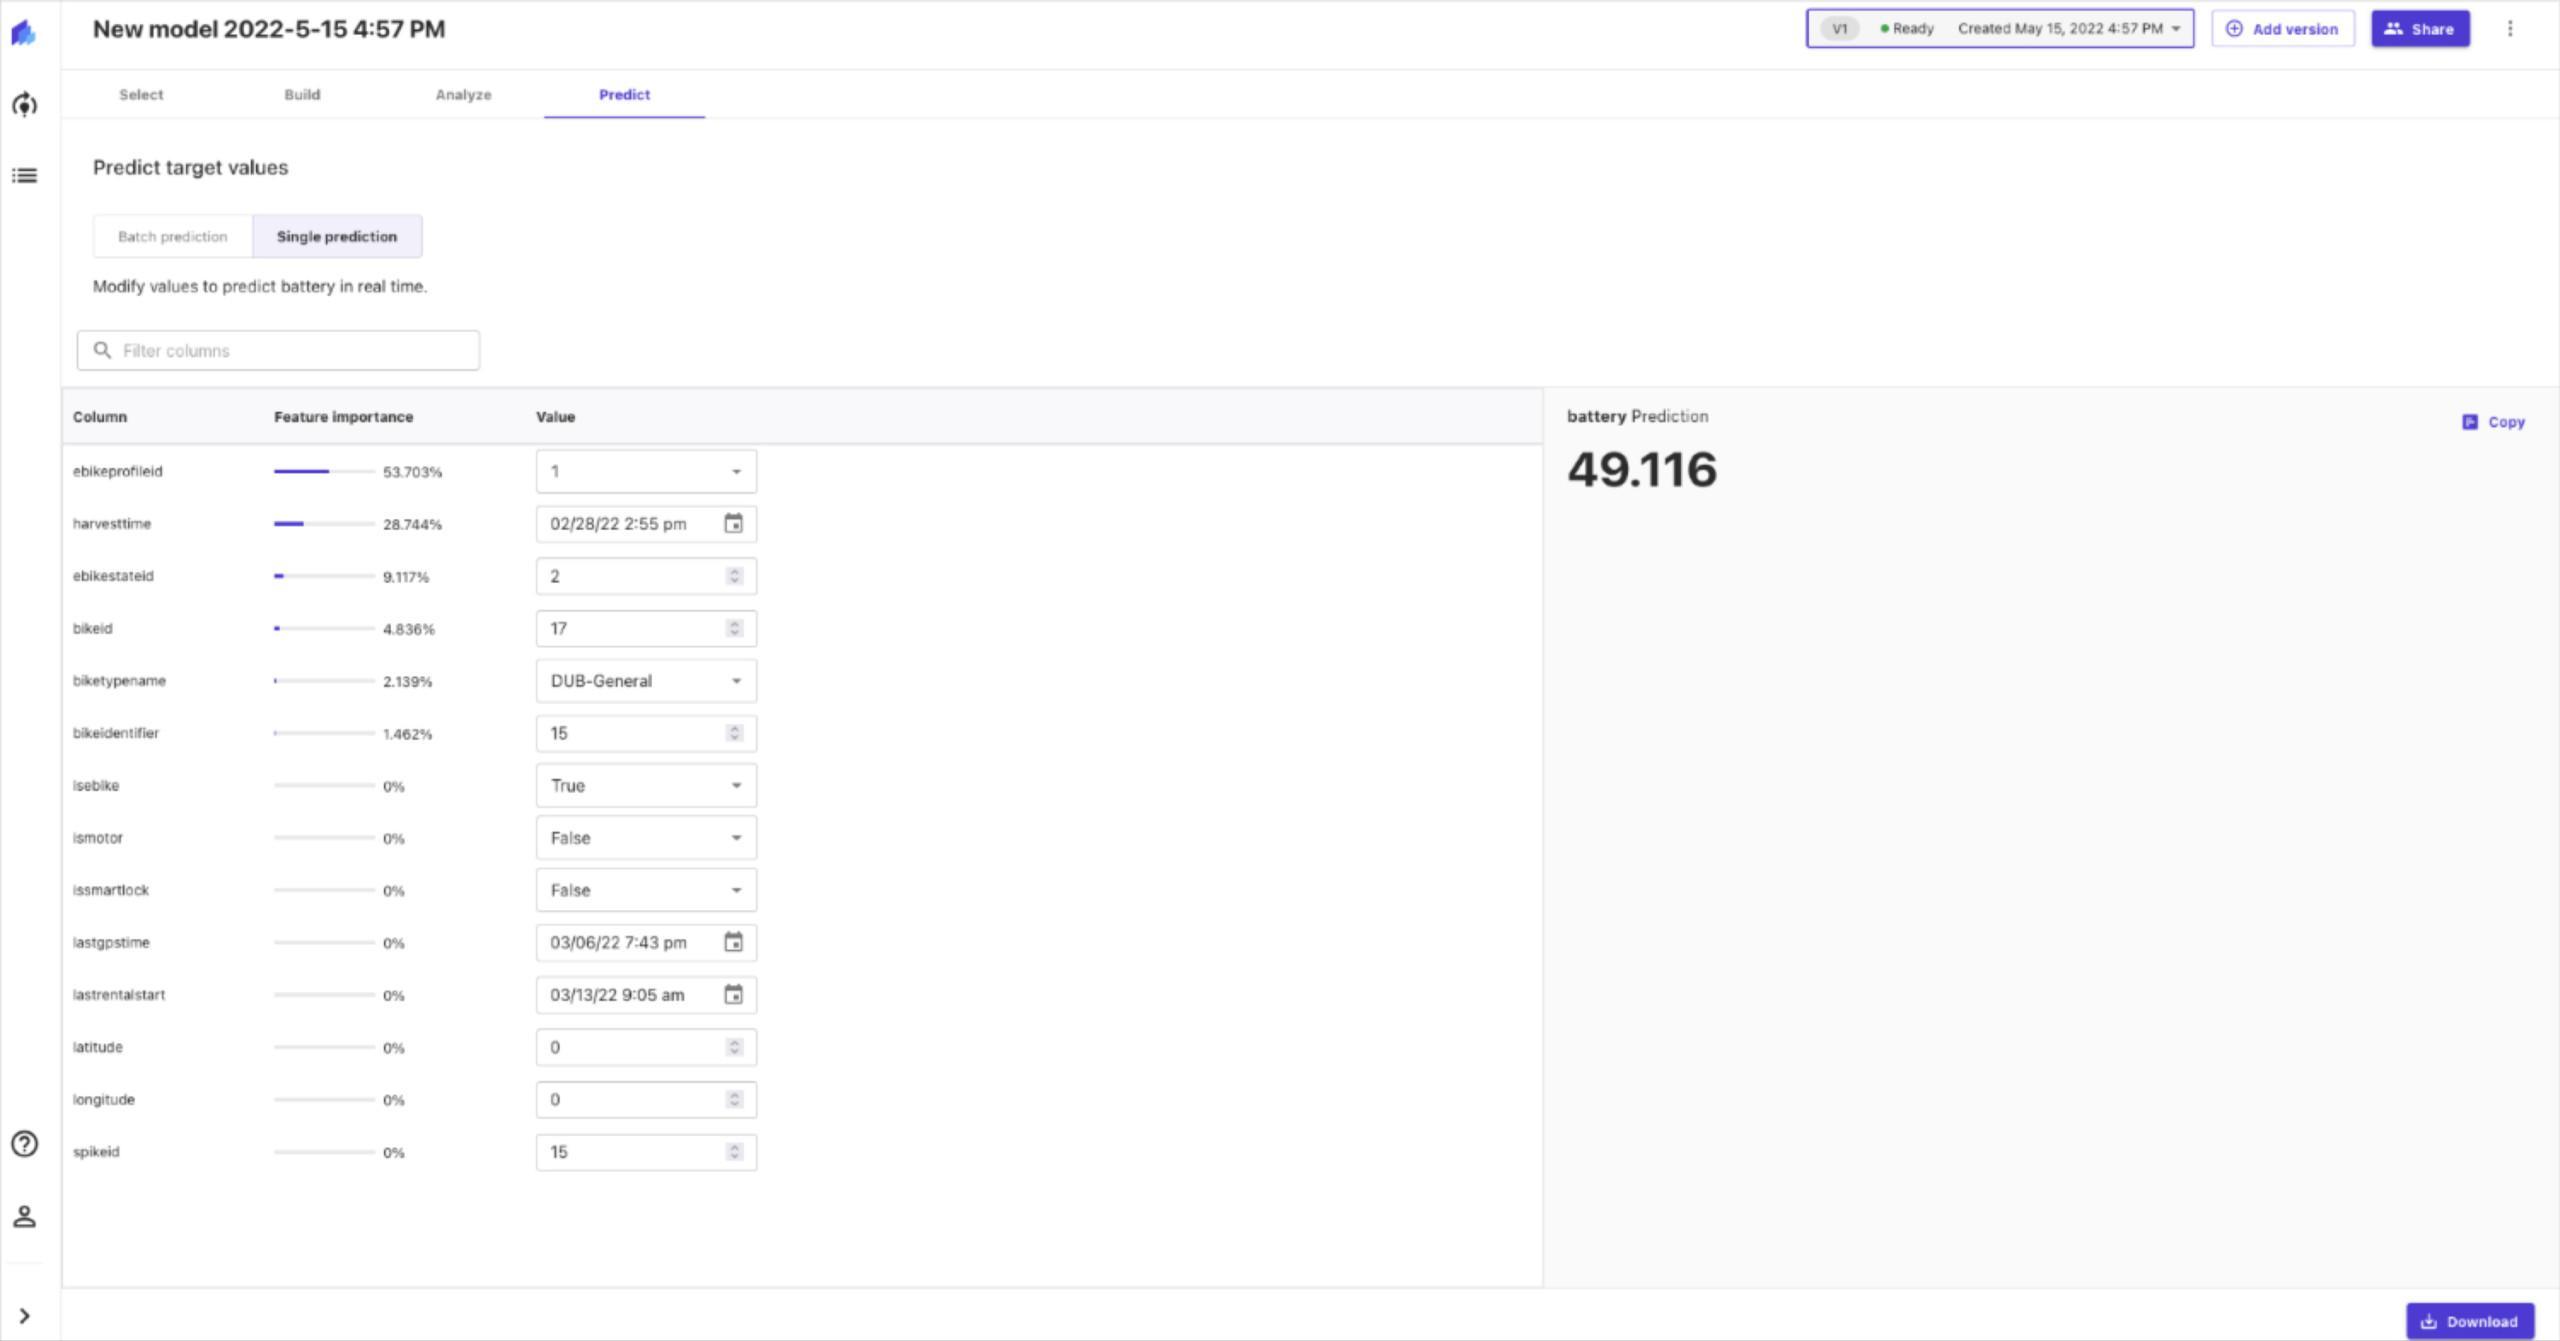
As a final step, we can use the model that was just built to make predictions. We can provide specific values and make a single prediction. We can also provide multiple data in the form of a CSV file and make batch predictions.

If we are satisfied with the model, we can share it to Amazon Sagemaker Studio, for further analysis. Sagemaker Studio is a web-based IDE that can be used for ML development. This is a more advanced ML platform geared towards data scientists to perform complex tasks with Machine Learning models. The model can be deployed and made available through an endpoint. Thereafter, existing systems can use these endpoints to make their predictions.

We will not be going over Sagemaker Studio as it is something that goes beyond AutoML. However, it is important to note that these AutoML cloud platforms are capable of going beyond tabular data. Both Sagemaker and Google AutoML are also capable of working with images, video, as well as text.

Conclusion

While there are many useful applications for AutoML, its simplicity comes with some drawbacks. The main issue that we noticed about AutoML especially with Sagemaker is the lack of flexibility. The platform provides features such as basic filtering, removal, and joining of multiple datasets. However, we could not perform basic derivations such as calculating the distance traveled using the coordinates, or measuring the duration of rentals. All of these should have been simple mathematical derivations based on existing features.

We also noticed issues with flexibility for the classification of battery levels. The ideal approach to this would be to have categories such as “low”, “medium”, and “high”. However, we were not allowed to define these categories or their corresponding threshold values. Instead, the values were chosen by the system automatically.

The main purpose of AutoML is to make Machine Learning available to those who are not experts in the field. As a benefit of this approach, this also becomes useful to people like data scientists. They do not have to spend a large amount of time and effort selecting an optimal model, and hyperparameter tuning.

Experts can make good use of low code AutoML platforms such as Sagemaker to validate any data they have collected. These systems could be utilised as a quick and easy way to produce well-optimised models for new datasets. The models would measure how good the data is. Experts also get an understanding about the type of model and hyperparameters that are best suited for their requirements.


Accelerate cloud data transformation

Cloud data transformation

Data silos and unpredicted costs preventing innovation

Cloud database race ?

One of the first cloud services was S3 launched in 2006.  AWS Hadoop based Amazon SimpleDB  was released in 2007 and after that there have been many nice cloud database products from multiple cloud hyperscalers. Database as a service (DBaaS) has been a prominent service when customers are looking for scaling, simplicity and taking advantage of the ecosystem. It has been estimated that the Cloud database and DBaaS market was estimated to be USD 12,540 Million by 2020, so no wonder there is a lot of activity. Looking from a customer point of view this is excellent news when the cloud database service race is on and new features are popping up and same time usage costs are getting lower. I can not remember the time when creating a global solution backed by a database would be so cost efficient as it is now.


Why should I move data assets to the Cloud ?

There are few obvious reasons like rapid setup, cost efficiency, scaling solutions and integration to other Cloud services. That will give nice security enforcement in many cases where old school username and password is not used like in some on premises systems still do.


“No need to maintain private data centers”, “No need to guess capacity”


Cloud computing instead typical on premises setup is distributed by nature, so computing and storage are separated. Data replication to other regions is supported out of the box in many solutions, so data can be stored as close as possible to end users for best in class user experience.

In the last few years even more database service can work seamlessly with on premises and cloud. Almost all data related cases have aspects of machine learning nowadays and Cloud empowers teams to enable machine learning in several different ways: in built into database services, purpose-built services or using native integrations. Just using the same development environment and using industry standard SQL you can do all ML phases easily. Database integrated AutoML aims to empower developers to create sophisticated ML models without having to deal with all the phases of ML – that is a great opportunity for any Citizen data scientist !


Purpose build databases to support diverse data models

Beauty of cloud comes rapidly with flexibility and pay as you go model with very real time cost monitoring. You can cherry pick the best purpose-built database (relational, key-value, document, in-memory, graph, time series, wide column, and ledger databases.) to suit your use case, data models and avoid building one big monolithic solution.

Snowflake is one of the few enterprise-ready cloud data warehouses that brings simplicity without sacrificing features and can be operated on any major cloud platform. Amazon Relational Database Service (Amazon RDS) makes it easy to set up, operate, and scale to any relational database in the cloud. Amazon Timestream is a nice option for serverless, super fast time series processing and near real time solutions. You might have a Hadoop system or running a non-scalable relational database on premises and think about how to get started on a journey for improved customer experience and digital services?

Success for your cloud data migration

We have worked with our customers to build a Data Migration strategy. That will help in understanding the migration options, create a plan and also validate future proof architecture.

Today we share with you here a few tips that might help you when planning data migrations.

  1. Employee experience – embrace your team, new possibilities and replace pure technical approach to include commitment from your team developers. Domain knowledge of data assets and applications is very important and building a trust to new solutions from day one.
  2. Challenge your partner of choice. There is more than lift and shift or creating all from scratch options. It might be that all data assets are not needed or useful anymore. Our team is working on a vertical slicing approach where the elephant is splitted to manageable pieces. Using state of the art accelerator solutions we can make an inventory using real life metrics. Let’s make sure that you can avoid the big bang and current systems can operate without impact even when building new systems.
  3. Bad design and technical debt of legacy systems. It’s very typical that old systems’ performance and design can be broken already.  That is something which is not visible to all stakeholders and when doing the first Cloud transformation all that will come visible will pop up. Prepare yourself for surprises – take that as an opportunity to build more robust architecture. Do not try to fix all problems at once !
  4. Automation to the bones. In order to be able to try and replay data make sure everything is fully automated including database, data loading and integrations. So, making a change is fun and not something to be careful of. It’s very hard to build DataOps to on premises systems because of the nature of operating models, contracts and hardware limitations. In Cloud those are not the blockers anymore.
  5. Define workloads and scope ( no low hanging fruits only) . Taking one database and moving that to the Cloud can not be used as any baseline when you have hundreds of databases. Metrics from the first one should not be used as a matrix multiplied by the amount of databases when thinking about the whole project scope. Take a variety of different workloads and solutions, some even the hard one to first sprint. It’s better to start immediately and not wait for any target systems because on Cloud that is totally redundant.
  6. Welcome Ops model improvement. On Cloud database metrics of performance (and any other kind) and audit trails are all visible so creating a more proactive and risk free ops model is at your fingertips. My advice is not to copy the existing Ops model with the current SLA as it is. High availability and recovery are different things – so do not mix those.
  7. Going for meta driven DW. In some cases choosing state of the art automated warehouse like Solita Agile Data Engine (ADE) will boost your business goals when you are ready to take a next step.


Let’s kick the Cloud Data transformation ongoing !

Take advantage of cloud when building digital services with less money and faster with our Accelerate cloud data transformation kickstart

You might be interested also Migrating to the cloud isn’t difficult, but how to do it right?