
Business intelligence in the 21st century
We are starting a blog series to go through the BI and data visualisation market. We will uncover each leading vendor in detail, take a look at the key challengers and anticipate where the market is going in the future. In this first post, we are going to delve into the world of business intelligence tools in the 21st century, and review the market and product changes over time.
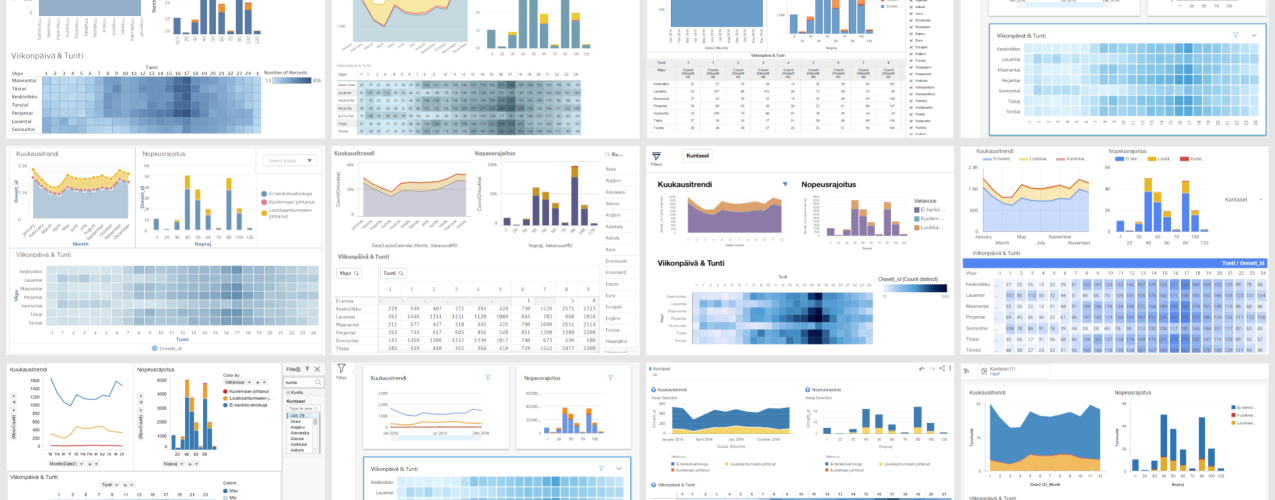
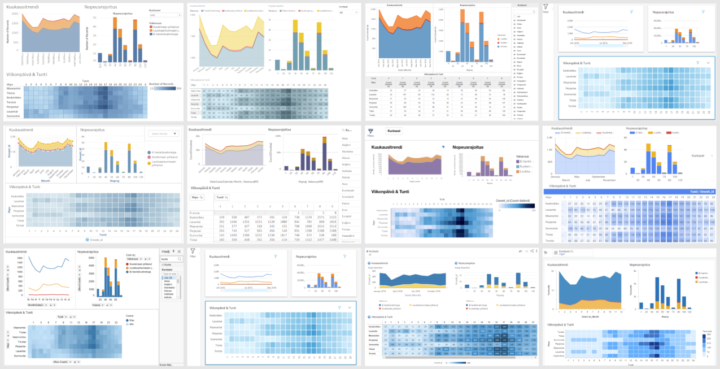
Occasionally, this blog series tackles our personal experiences and views in relation to tools. Still, the actual assessments have been made objectively and technology agnostically – just like tool assessments are supposed to. If you wish to go through the interactive visualisation based on the content of “Gartner Magic Quadrant for Analytics & BI”, from where the attached figures have been taken, you can do so at Tableau Public: Gartner MQ for Analytics & BI visualisation
Current kings of the hill
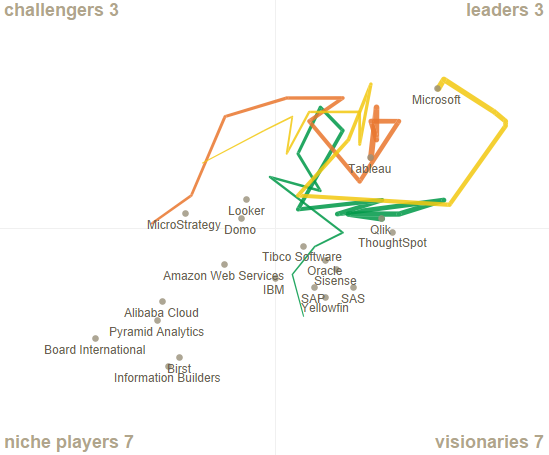
For a long time now, the leaders in the data visualisation tool market have been Tableau, Microsoft, and Qlik. These vendors entered Gartner’s Magic Quadrant Leader section in 2008 (Microsoft), 2011 (Qlik), and 2013 (Tableau). And they have held their position ever since. Tableau and Qlik have remained quite stable within a small area, whereas Microsoft has bounced around the quadrant (possibly due to their transfer from the old SSRS/SSAS stack to Power BI).
These tools have gained a stable market position, and each of them has their own strengths and users. Various rivals are regularly knocking on the door in the hope of attending the party, but, for the moment, they have always come away disappointed and been forced to gain new momentum in other quadrants. Before going into more detail about these kings of the hill, let’s review how the current situation has come about in terms of vendors and tool evolution.
Acquisitions and Bitcoins
Previous kings of the hill, i.e., vendors in the leaders quadrant, were IBM/Cognos, SAP/BusinessObject, Oracle/Hyperion, SAS and MicroStrategy. During the first decade of the 21st century, especially in 2007, BI reporting market was consolidating fast. The IT giants of that time acquired the long-term market leaders: Oracle announced its acquisition of Hyperion in March 2007; SAP announced its acquisition of BusinessObjects in October 2007; and IBM announced its acquisition of Cognos in November 2007. The acquired market leaders were previously themselves purchasing industry rivals and minor companies (such as Crystal Decision, Applix and Acta Technologies).
Based on Gartner’s Magic Quadrant, the leaders were still going strong about four years after these acquisitions. But then they started to slip down the slippery slope. Well, to be precise, SAP/BusinessObjects started its decline a bit earlier. Maybe the strong identification with the SAP family did not promote success. I cannot say whether the decline of the leaders was more due to the uncertainty caused by these business acquisitions: difficulty to integrate the organisations and the products, or due to the fact that renewal is always hard for market leaders. Development stalls because companies don’t want to cannibalise their own market, and when customers abandon the ship and start rooting for more innovative rivals, companies complicate their licensing model and push up the prices. And this really gets the rest of the customers going!
MicroStrategy and SAS didn’t immerse themselves as much in business acquisitions, but still they shared the same fate with their rivals ruling the market at the turn of the 2010s. The offering stalled, at least in the area of data visualisation, and MicroStrategy is probably more famous today for its Bitcoins than its product offering.
OLAP-cubes
Let’s forget the vendors for a moment and start looking at product evolution. The first BI tools emerged at the end of 1980s, but they started to flourish in the 1990s. Data warehouses were rare in those days, and most BI tools included features that allowed users to obtain data directly from operative systems and download it into the tool’s own data model. One popular data storage was OLAP-cubes that were easy to use and view from different perspectives by filtering into the most interesting slice of information.
The most popular presentations were crosstabs and various pixel perfect listings, so the content was still not that visual. The users were mostly from finance departments, so for the end users, this numeric presentation was surely just the perfect one. Some example products from the 1990s worth mentioning include Cognos PowerPlay Transformer, Crystal Reports, and Oracle Discoverer. Qlikview also has its roots in the ‘90s, but let’s not go there yet.
OLAP-cube and report-centred solutions built directly on top of operative systems were often quite fragmented. Different departments could have made their own solutions in which each separate cube or report might have had its own data models and data refresh tasks straining the source database. This made the solution complex to maintain and caused unnecessary load to data sources. Partially due to these reasons, data warehouses increased in popularity and there was a demand for more centralised reporting solutions.
From a novelty to a dinosaur in 10 years
In early 21st century, comprehensive Enterprise BI systems started to emerge in the market. They enabled the creation of extensive solutions covering various departments and functions. The development work often required very specific competence, and it mostly focused on a BI competence centre under IT or finance departments. In the competence centre, or as subcontractors, BI developers tried their best to understand the needs of the end users and created metamodels, built OLAP-cubes, and produced reports. More graphs and KPI indicators started to appear in the solutions. Some even created dashboards containing the most essential data. In those times, graphic elements included speed gauge charts, 3D effects, gradient colors, pie charts, and other “fantastic” visual presentations. It’s not really surprising that users often wanted numeric data and these early graphs were not a hit.
New functionalities were added to these Enterprise BI tools as vendors acquired other companies and their products were integrated into existing systems. Existing components or functionalities were rarely discontinued and these newly integrated functionalities often seemed to be flimsy stick-and-bubble-gum contraptions. Over the years, Enterprise BI solutions became so fragmented and complicated that even experienced specialists struggled to make out what each component or “studio” was for (or maybe it was just me who didn’t always understand this).
Visual self-service
The clumsiness and difficulty of a centralised BI organisation and Enterprise tools accelerated the agile and easy-to-use self-service BI and data visualisation. At the turn of the 2010s, Tableau – established almost ten years earlier – started to gain a reputation as a new kind of visual analytics tool that could be used for data analysis even by people without much technical knowledge. Tableau wasn’t marketed to IT departments but directly to business operations. It didn’t try to replace existing Enterprise BI tools in companies but positioned itself alongside them directly in the business units, which now had the chance to create their own reporting content either without or partially with a data warehouse.
Gradually, other similar tools started to appear on the market: Microsoft Power BI, Qlik Sense, SAP Lumira, Oracle Data Visualisation Desktop etc. Also enterprise BI vendors started to include more features directed at business users in their solutions. In an evaluation of self-service BI tools I did a few years ago, already 13 different tools were included, so there were plenty of tools available at the time. However, when the tools were examined in detail, it was clear that some of them had resorted to shortcuts or had taken the easy way out. Most of these tools haven’t become hugely popular, and some might even be discontinued by now.
New rivals
In the early 2010s, brand new start-ups were aiming to enter the data visualisation market with slightly different approaches. The big data hype brought along a bunch of Hadoop-based platforms, such as Platfora, Datameer and Zoomdata. Another trend was SaaS (Software as a Service) type reporting and visualisation services offered only in the cloud. These services included Clearstory Data, GoodData, Chartio, Domo, and Bime. The third trend was AI- and search-based solutions in which the user could analyse and retrieve data in a very automated manner, a bit like using a Google search. Some examples include Beyondcore and ThoughtSpot. Some new tools were very heavily relying on the performance of cloud databases, and they didn’t offer the possibility to extract and store data within the tool. A lighter version of this approach is Periscope Data, while a more versatile version is Looker.
Guess what has happened to most of these new rivals? Around 70% of the tools mentioned above are already acquired by another company. So again, consolidation lives strong in the market. The biggest business acquisitions in the industry in recent years have been Salesforce’s acquisition of Tableau ($15,7B) and Google’s acquisition of Looker ($2,6B). Both of these acquisitions were announced in June 2019.
A union between decentralised and centralised
Perhaps the biggest problem of self-service tools has been the limited possibilities to control and monitor the environment and the published content in a centralised manner. On several occasions, I’ve seen how a self-service environment has been filled with hundreds of data sets and thousands of reports and no one has had a clear visibility of which content is relevant and which is not. As governance is not enforced in the tools, they have to be created and implemented separately for each organisation. Luckily, the self-service BI tools of today are already offering better features to centrally control and monitor the environment and contents.
Another important aspect to consider when self-service tools and centrally controlled solutions are approaching each other is bimodal BI. This means that both centrally controlled content (often predefined and stable) and more agile self-service content (often more exploratory) can be flexibly developed and utilised in parallel. Current BI tools mostly support both of these modes but there are still gaps in how different types of contents can be infused together. A bigger challenge, however, is how to change the data culture, processes and governance practicalities to make the bimodal way of working easier and more flexible.
The death of data warehouses and dashboards
In the past ten years, it has been repeatedly predicted that data warehouses are dying. A ton of Qlikview solutions that are based on a strong internal data storage have been implemented without use of a data warehouse, and this might be well justified on a smaller scale. Virtualisation, Hadoop, data lakes and the like have been killing data warehouses in turns but it is still going strong. This is more marketing hype rather than reality. It is true that building data warehouses has changed irrevocably. The ETL tools leading the market 10 to 15 years ago as well as the manual and slow way of building data warehouses has died. There have never been as many ways to implement and use a data warehouse as today. So data warehouses are alive and kicking. But don’t get me wrong – they are not and never will be the solution for everything.
Some people are predicting a similar fate for dashboards. The most provocative example might be the ad by ThoughtSpot which proclaims: “Dashboards are dead”. Machine learning and AI based visualisation and data search solutions predict hard times for dashboards and traditional BI. Data science platforms have been implying the same. Most of this is purely a marketing gimmick. Or course the tools themselves and our ways of using them are constantly changing and developing. One direction for development is certainly machine learning and NLP (Natural Language Processing), and the convergence of different kinds of tools.
It will be interesting to see how the current market leaders will act when new functionalities are developed and diversified into tools. Will companies discontinue existing functionalities or parts of the tools when replacements are launched. Or will existing tools again turn into dinosaurs left to be trampled on by new rivals? Or will the giant vendors integrate their other offerings too tightly with their BI tools so that they won’t be viable options in environments already using competitors’ tech stack?
Thanks and stay tuned
In the following posts of this series, each of the key market-leading tools are covered one by one. A bit later we’ll also review some smaller rivals in detail. Leave us a comment or send an email if you want to read about a certain tool or aspect. We’ll also examine later where the Business Intelligence & data analysis tool market is going and what we can expect in the future. A preliminary schedule for the blog series is as follows:
- Business intelligence in the 21st century (this post)
- Tableau – a pioneer of modern self-service business intelligence
- Power BI deep dive
- Qlik deep dive – week 44
- Other relevant vendors – week 46
- Trends and the future – week 48
If you are interested in data visualisation solutions or tools, please feel free to contact tero.honko@solita.fi. And finally a big thank you for reading the post!