

Greetings from the Bay Area – IBM Think 2019 Part 2
IBM Think 2019 contained several very interesting sessions, as described earlier. Several product and feature launches aroused great interest in event participants, and we share the best bits with you!
To start with an important side note, IBM showed a disclaimer in every presentation that the new features may or may not be implemented during upcoming releases and they did not want to promise any hard date for those new features (need to say the same in the blog post because we do not want to make too big promises…).
IBM presented bringing the full power of AI to business intelligence. What does that then mean in practice? Cognos Analytics storytelling, recommendations, automated visualizations, natural language questions, reusable content and advanced analytics. IBM is putting lot of effort to make analytics, data science and machine learning more accessible and easier for use for its customers.
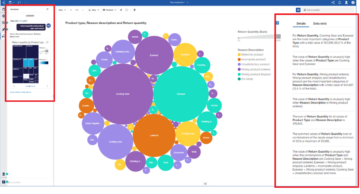
We had a change to test latest version of Cognos and its Exploration tool. User can get advanced analytics insights and contextual recommendations of their data in a very easy way (picture below). Exploration works with relational data sets and you can test it easily with the existing data or make a new data set with the data module tool (data modelling and preparation tool) inside cognos analytics.
There are lot of new features and improvements in new Cognos Analytics versions 11.0.13 and 11.1. Those contain for example, several dashboarding improvements, data module supporting relative dates, aggregation roll ups, security, reporting navigations and usability as well as copy > paste (which actually works), enabling visualizations and other objects copied from Explorer reports or Dashboards to reports or the other way.
How about news on Planning Analytics? To start with, IBM Planning Analytics is a planning, budgeting, forecasting solution which runs on IBM Cloud as a service or it can be installed to organization’s own on-premise server. For starters, IBM stated that they are now investing heavily on Planning Analytics Cloud. The development activities are focusing on the end-user tools such as Planning Analytics for Excel and Planning Analytics Workspace and interoperability between these two components. Concretely, this means that IBM is publishing new version of Workspace almost every month containing new features and nitty-gritty fixes. Although, IBM is talking a lot about new components of Planning Analytics, it was nice to notice that the good old developer tools such as Architect will remain under the hood of Planning Analytics and there are no short term solution to remove Architech, but eventually our assumption is that all the modelling will be done in PAW.
One of the biggest new features in Planning Analytics for Excel (PAx) and Planning Analytics Workspace (PAW) is the alternative hierarchies. Alternative hierarchies feature has been introduced in Workspace earlier already but during the conference we learned that the feature will be supported in Exploration views in Planning Analytics for Excel as well. In addition, as mentioned earlier, interoperability between Planning Analytics for Excel and Workspace will be enhanced. For example, PAx has always been able to open and save views from the TM1 Database and in the future views can be opened from the PA Content store which is inside Planning Analytics Workspace. For example, user can create own calculations in PAx and publish those in Workspace. Moreover, PAW will support action buttons which can trigger parameterized TI Scripts by users. Finally from the TM1 server side, the biggest improvement is integration with GIT which enables better version control.

We went through a lot of technical deep-dive sessions, but there were also interesting customer case introductions such as Deutsche Bahn, Uber, Montage International and Theravance Biopharma. Maybe one of the most exciting one was related to Deutsche Bahn’s TM1 model which may be one of world’s largest TM1 implementation. For example, they have over 6000 users, 8 servers which are boosted with 72 cores, 2TB RAM per machine and they receive over 50 million records monthly. It was pretty interesting to hear how they have managed to build such solution and use it as a company-wide performance management solution.
Interested to continue the discussion? Come talk to us at Chief of Finance event, call us at +358 29 170 3300 or mail us at contact(at)solita.fi!